
Explainability: how do we apply it in BBVA AI Factory?
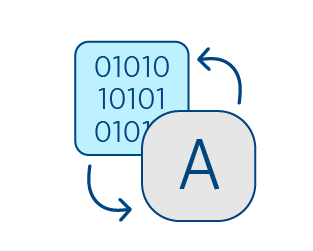
Etymologically, the word “explain” comes from the Latin “explanare,” which is formed by the particle ex (to take out, to move from the inside to the outside) and planus (to spread). Semantically, its meaning alludes to unrolling something folded to make it visible. At BBVA AI Factory, we do this with Machine Learning models: unravel them to look inside and, thus, unravel their complexity to shed light on how they work.
Explainable Artificial Intelligence (XAI) has recently gained prominence by bridging algorithmic decisions and their developers. The overall goal of implementing explainability techniques is, on the one hand, to understand the logic behind Machine Learning models and, on the other hand, to translate the performance of algorithms into human language.
Use cases: different applications of explainability
In the financial sector it is crucial to ensure transparency when using Machine Learning systems. For this reason, explainability techniques are widespread among AI Factory teams. We have even developed a package within our data science library, Mercury, which is available to everyone. In a previous article, we summarized all the information about mercury-explainability. Today, we take a look at several use cases where explainability is applied.
Explainability to translate algorithmic decisions into business language
One of the objectives we pursue when applying explainability techniques is to make the decisions suggested by the algorithms understandable for both stakeholders and end users. Whenever we create and train a Machine Learning model, it is essential to explain to the business units why it makes one decision or another.
A clear example occurs when we create algorithms that personalize the customer experience in the bank’s mobile application. Personalization means the app environment will be tailored to each customer’s financial situation and transactional movements. From a user’s data, the model will decide which prompt, action, or suggestion best suits each user, so there will be a correlation between the customer and what the mobile app interface displays.
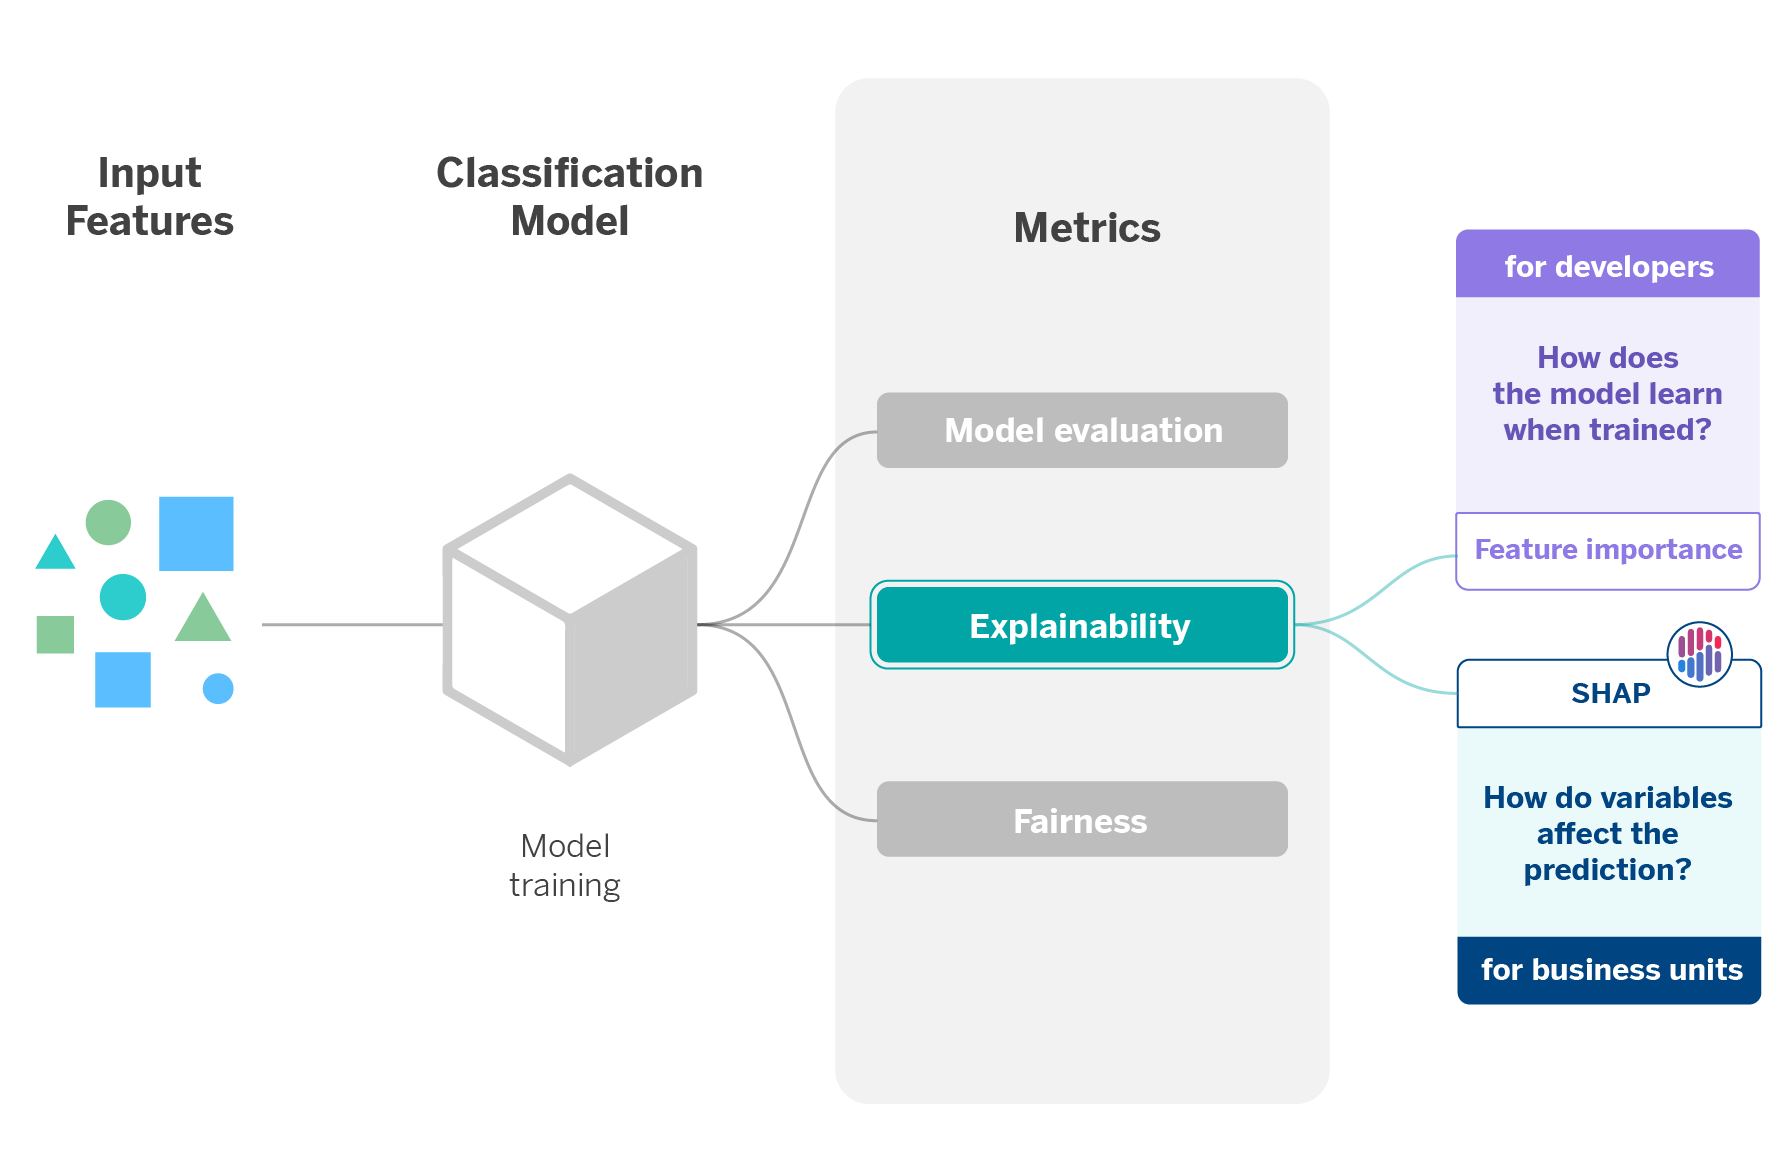
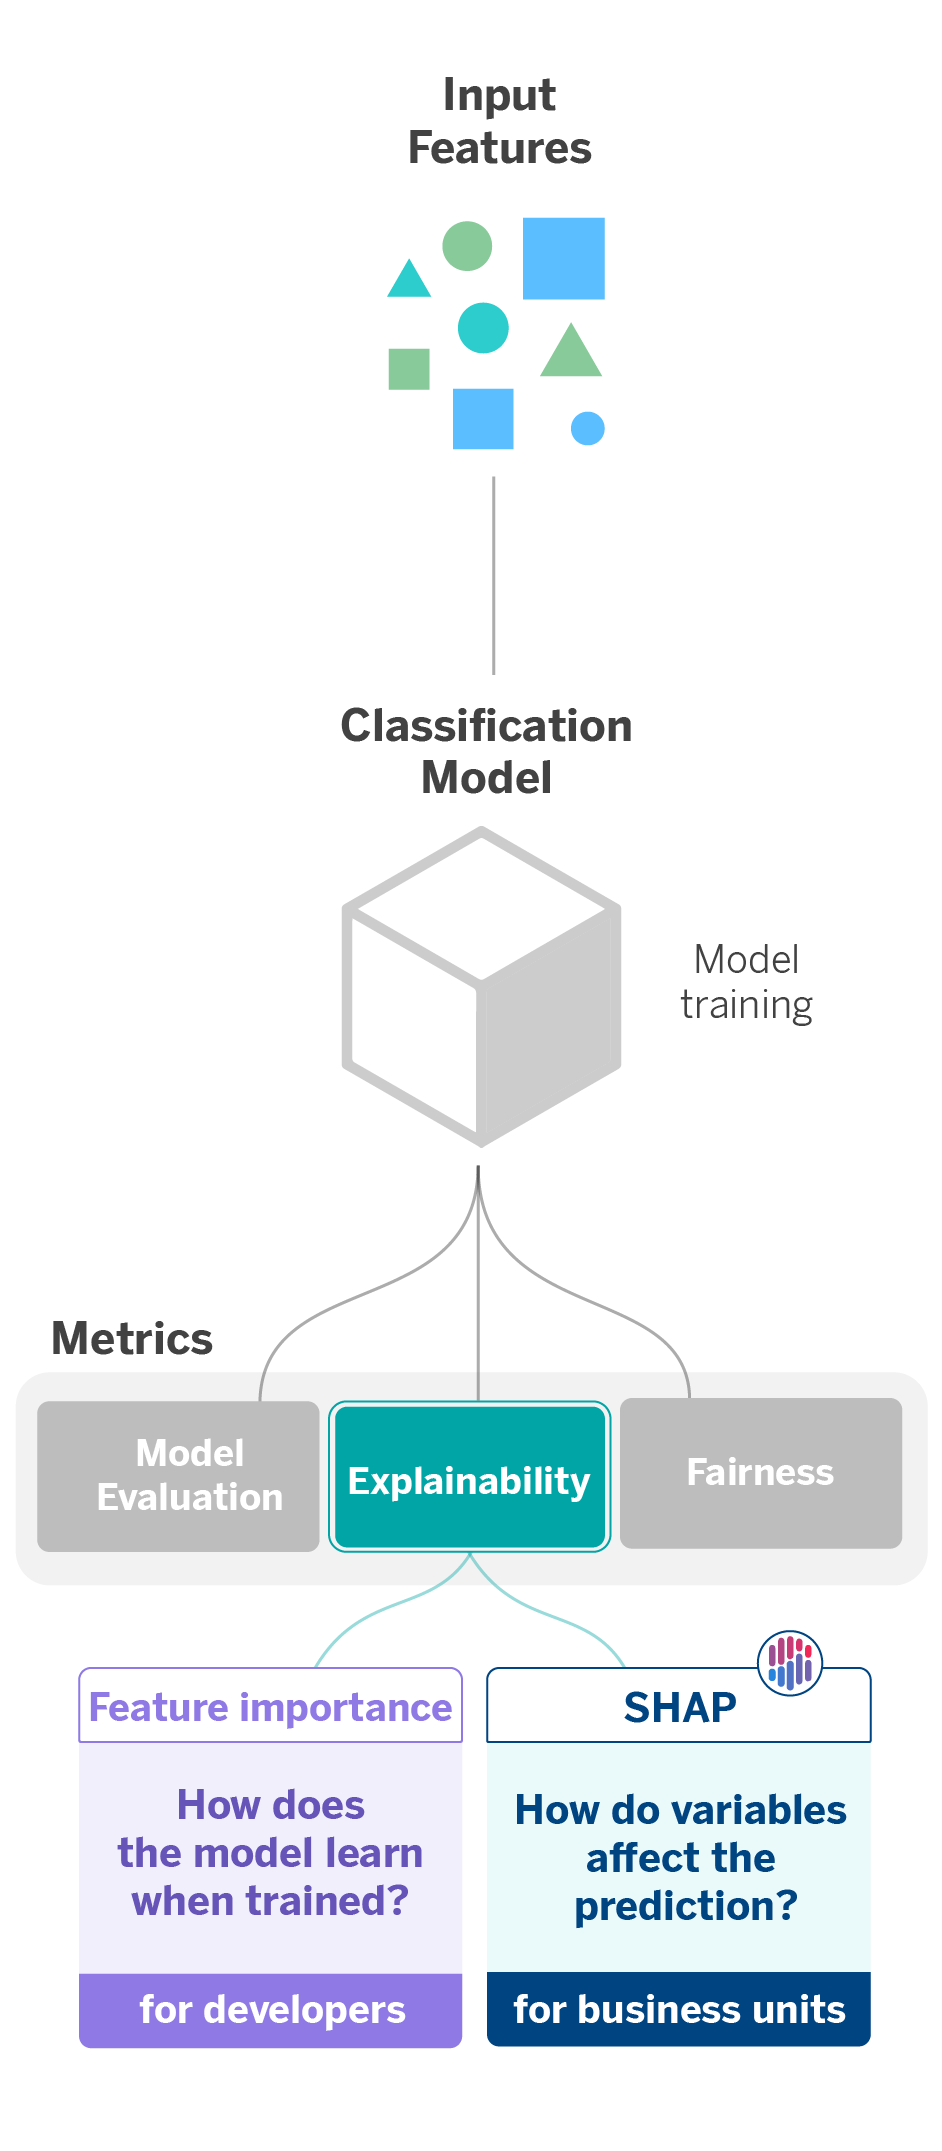
This correlation considers individual variables that will affect the prediction to a greater or lesser extent. In this line, explainability is applied in two ways: on the one hand, to understand how the model learns when trained and, on the other hand, to extract the weight of the variables and to what extent they affect the prediction.
The first application of explainability considers the feature importance scores, which are extracted to determine each variable’s relative importance in a dataset. These scores are beneficial when explaining the data with which the model is trained. The result it offers allows us to understand which are the most important features or characteristics and how this produces that they have more weight than others during model learning.
Most of the models used in AI Factory inherently contain the feature importance scores. In the case of using models that do not provide them, there are agnostic methods to obtain them independently of the model used. An example is the Permutation Feature Importance method, based on the changes that the prediction error suffers when there is a change in the order of the features used by the model.
The second application involves SHAP (SHapley Additive exPlanations), a set of explainability techniques that assign each feature’s relevance value or contribution to a prediction. SHAP is based on the calculation of Shapley values, a method of cooperative game theory, where each feature or a set of features has a role as a player. This way, we know how the prediction (game payoff) is distributed among the different features (players)1.
Among the benefits of SHAP, we highlight its alternatives, which help us obtain the explainability of our models as if they were a black box (KernelSHAP) or, in the case of tree-based models (TreeSHAP).
In this particular case, we use SHAP to explain to the business unit how the variables influence the prediction of each class of the personalization model, noting which ones affect more and to what extent. Thus, it is possible to justify why one decision is made for one customer or another.

Explainability to interpret unsupervised problems
When developing Machine Learning models, there are two paradigms: supervised and unsupervised. Supervised learning starts from training data that teaches the model what output it should generate for a specific case. On the other hand, the data are not previously labeled in unsupervised learning, so there is no a priori knowledge about them. Therefore, the model’s output is a decision made by the algorithm based on the common and differential patterns it finds in the data.
One of the main advantages of unsupervised models is that they avoid the biases that can occur when data are manually labeled. Thus, these models explore the entire universe of existing correlations between variables to be trained automatically. However, it is essential to explain the reason for the algorithm’s decisions to validate its performance and reliability.
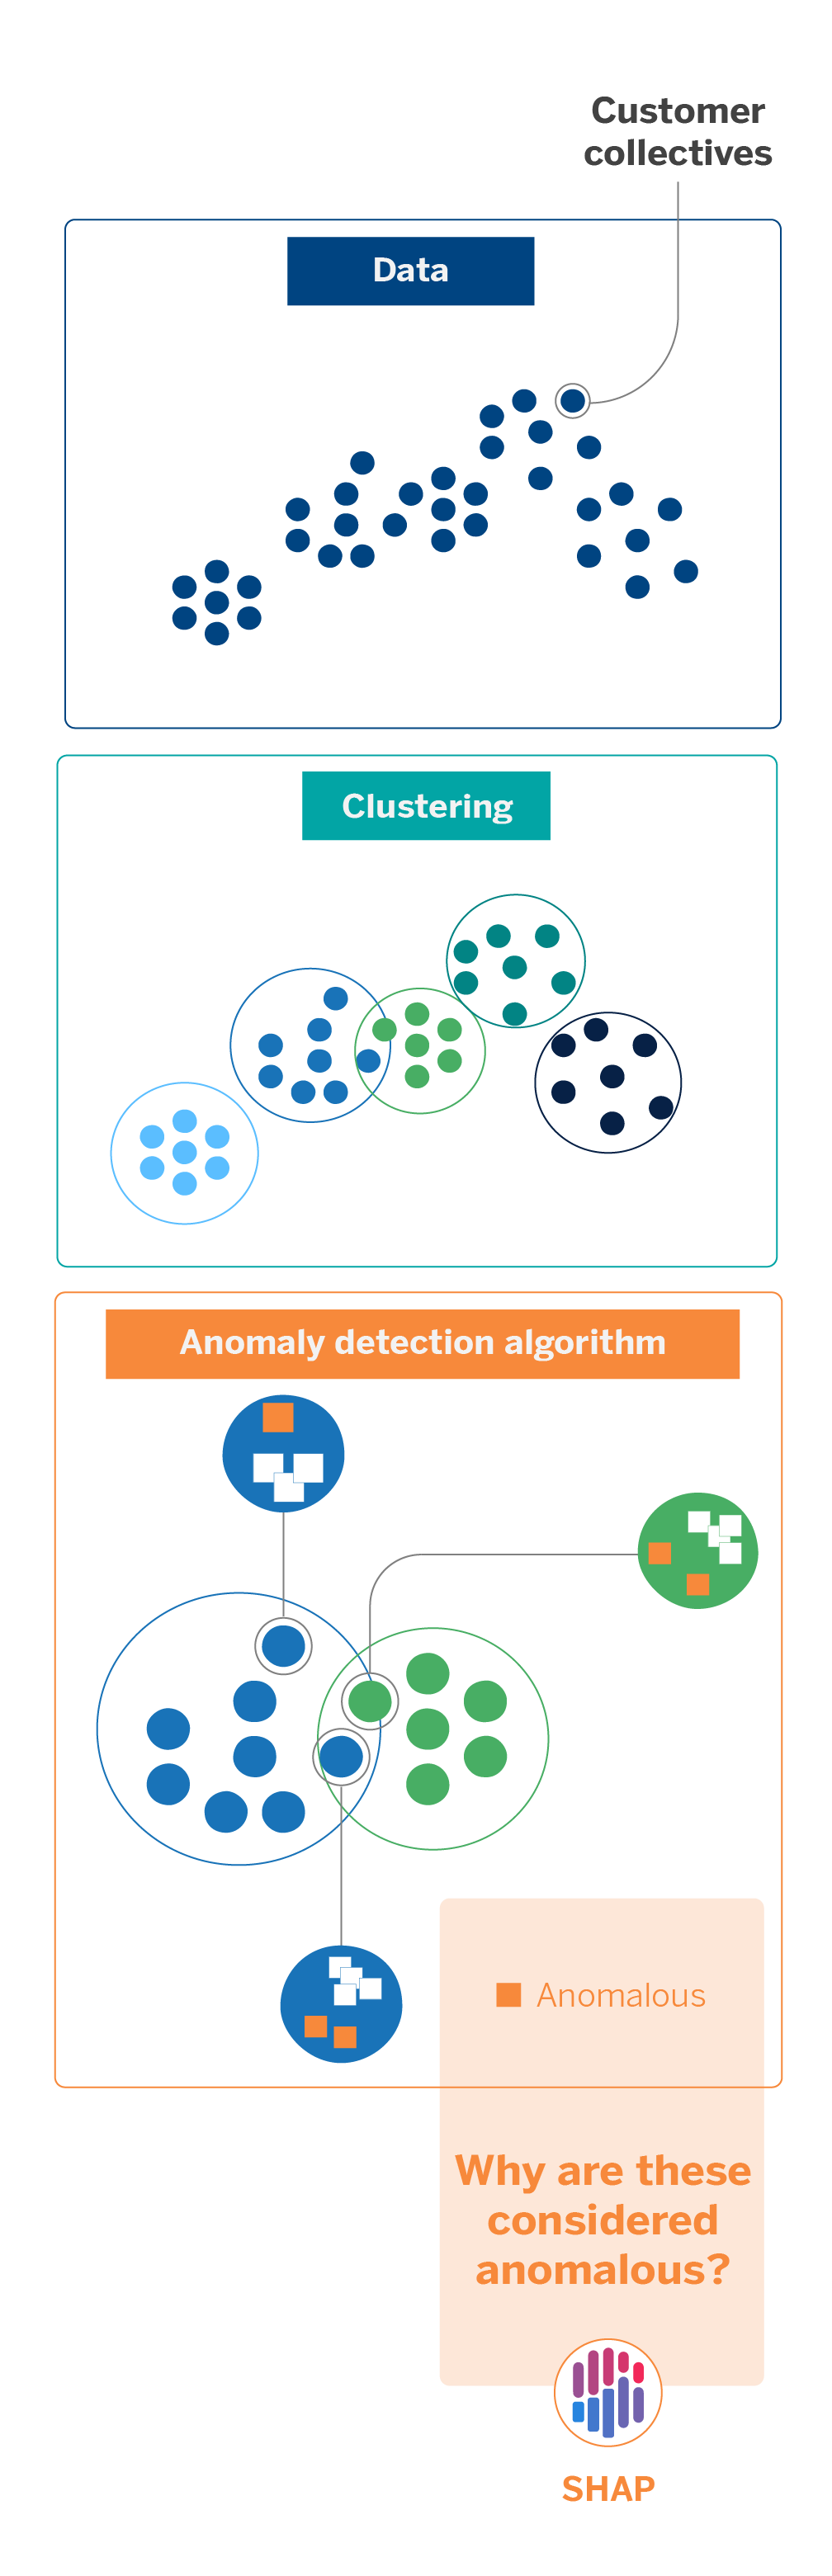
An application of this explainable approach occurs when we perform customer segmentation. Given the immense amount of data we work with at AI Factory, we approach this task using clustering models.
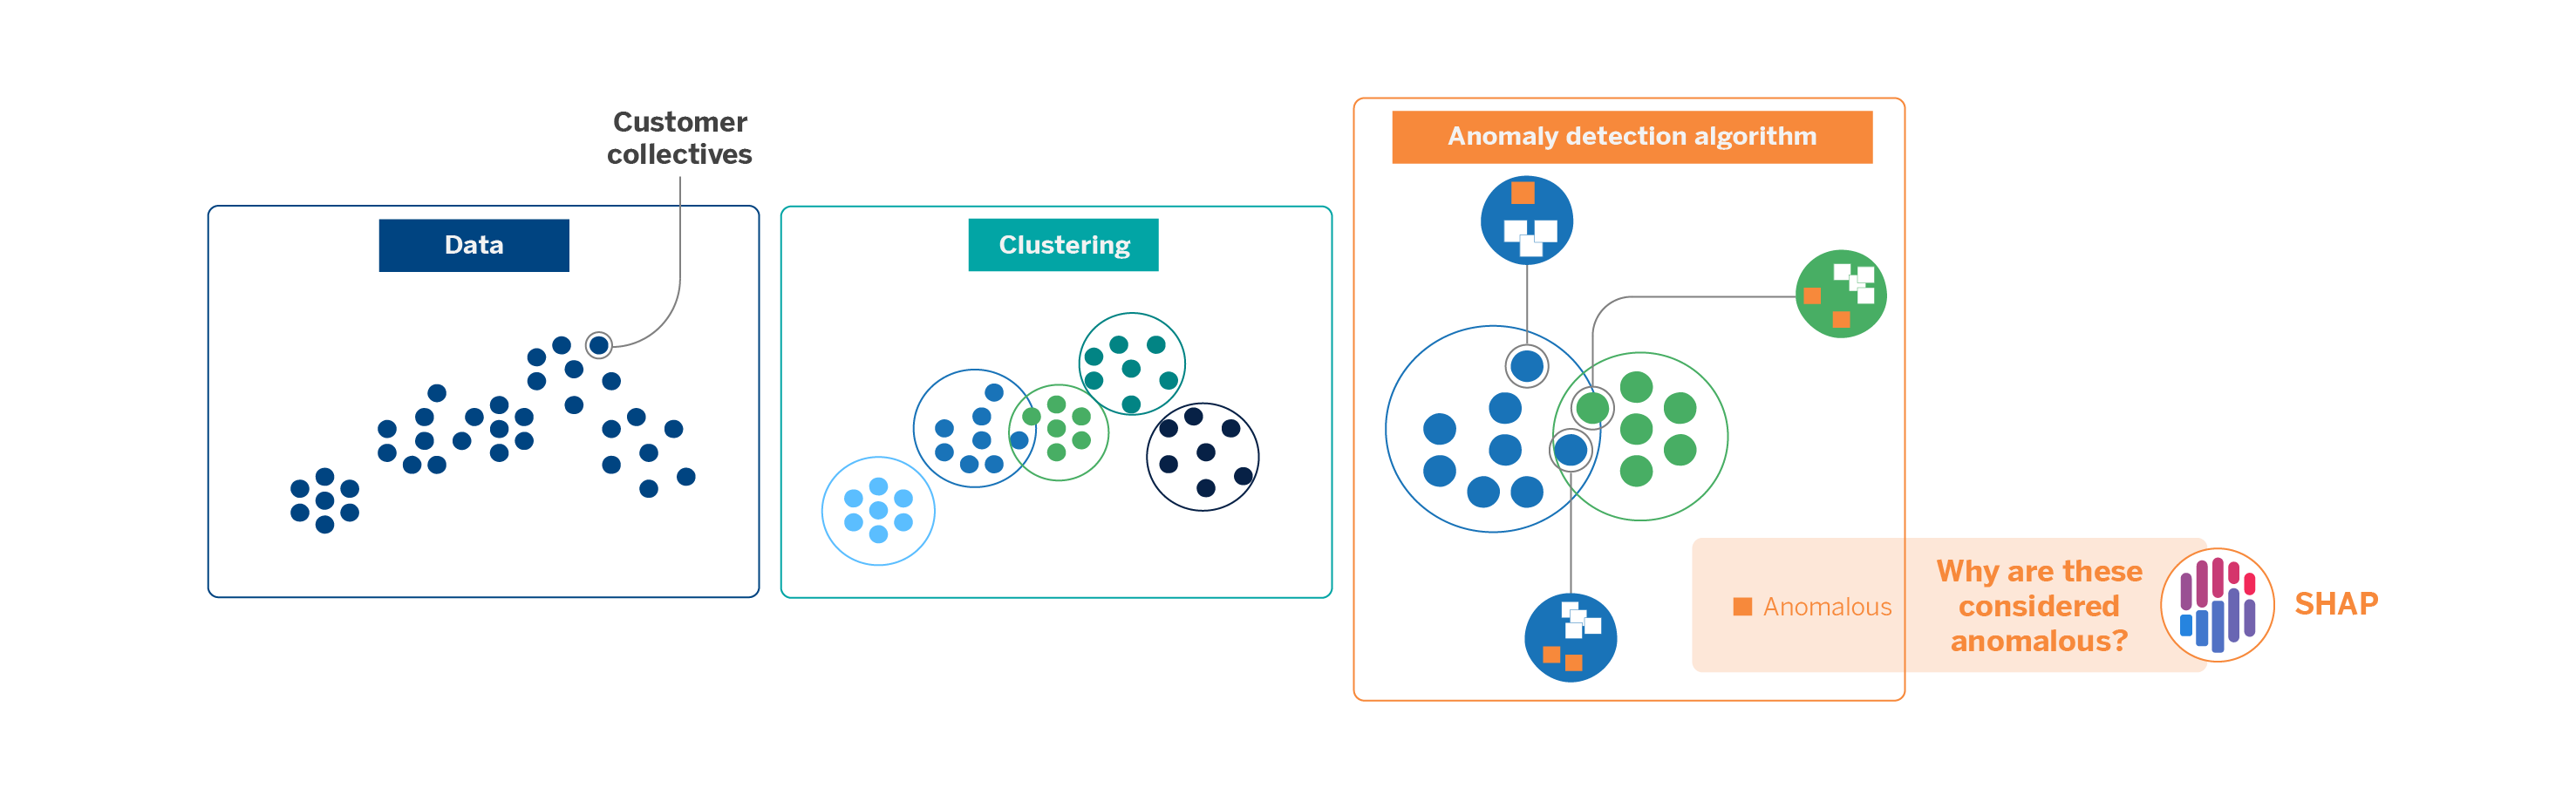
Clustering is an unsupervised learning technique that groups observations from a data set based on shared traits. In our case, we apply it to classify the universe of customer groups to differentiate between them. Age, occupation, and transactional data are some factors that facilitate the creation of clusters.
Visually, clusters can be well differentiated from each other, but there will always be samples that can fit into other clusters by their distribution. To detect anomalies in the clusters, avoiding the already existing manual rules and, thus, be able to refine the universe that each comprises, we applied an anomaly detection algorithm. This tree-like Artificial Intelligence technique is simple and quick to apply but only partially interpretable. When we use it, questions arise, such as why the algorithm considers a particular observation anomalous. How can the result be interpreted? Does the model consider some variables more relevant than others?
The outputs of the anomaly detection models are scores by which the model ranks the degree of anomaly it detects for each observation. To interpret these results at the local level, we use SHAP, which, as we have seen, gives weights to each of the variables or features involved in creating the models. These weights, the Shapley values, allow us to understand better how the model works and which parameters contribute to the result to a greater or lesser extent.
In this sense, using explainability techniques helps us validate models that, due to their unsupervised nature, usually offer good but poorly interpretable results. Thus, we can alleviate the uncertainty of algorithms understood as a “black box” and guarantee the transparency, auditability, and traceability of the results they offer.

Explainability to improve models
At AI Factory, we also apply explainability methods to debug models. If we know which variables influence the decisions made by the model, we can optimize it to obtain better metrics.
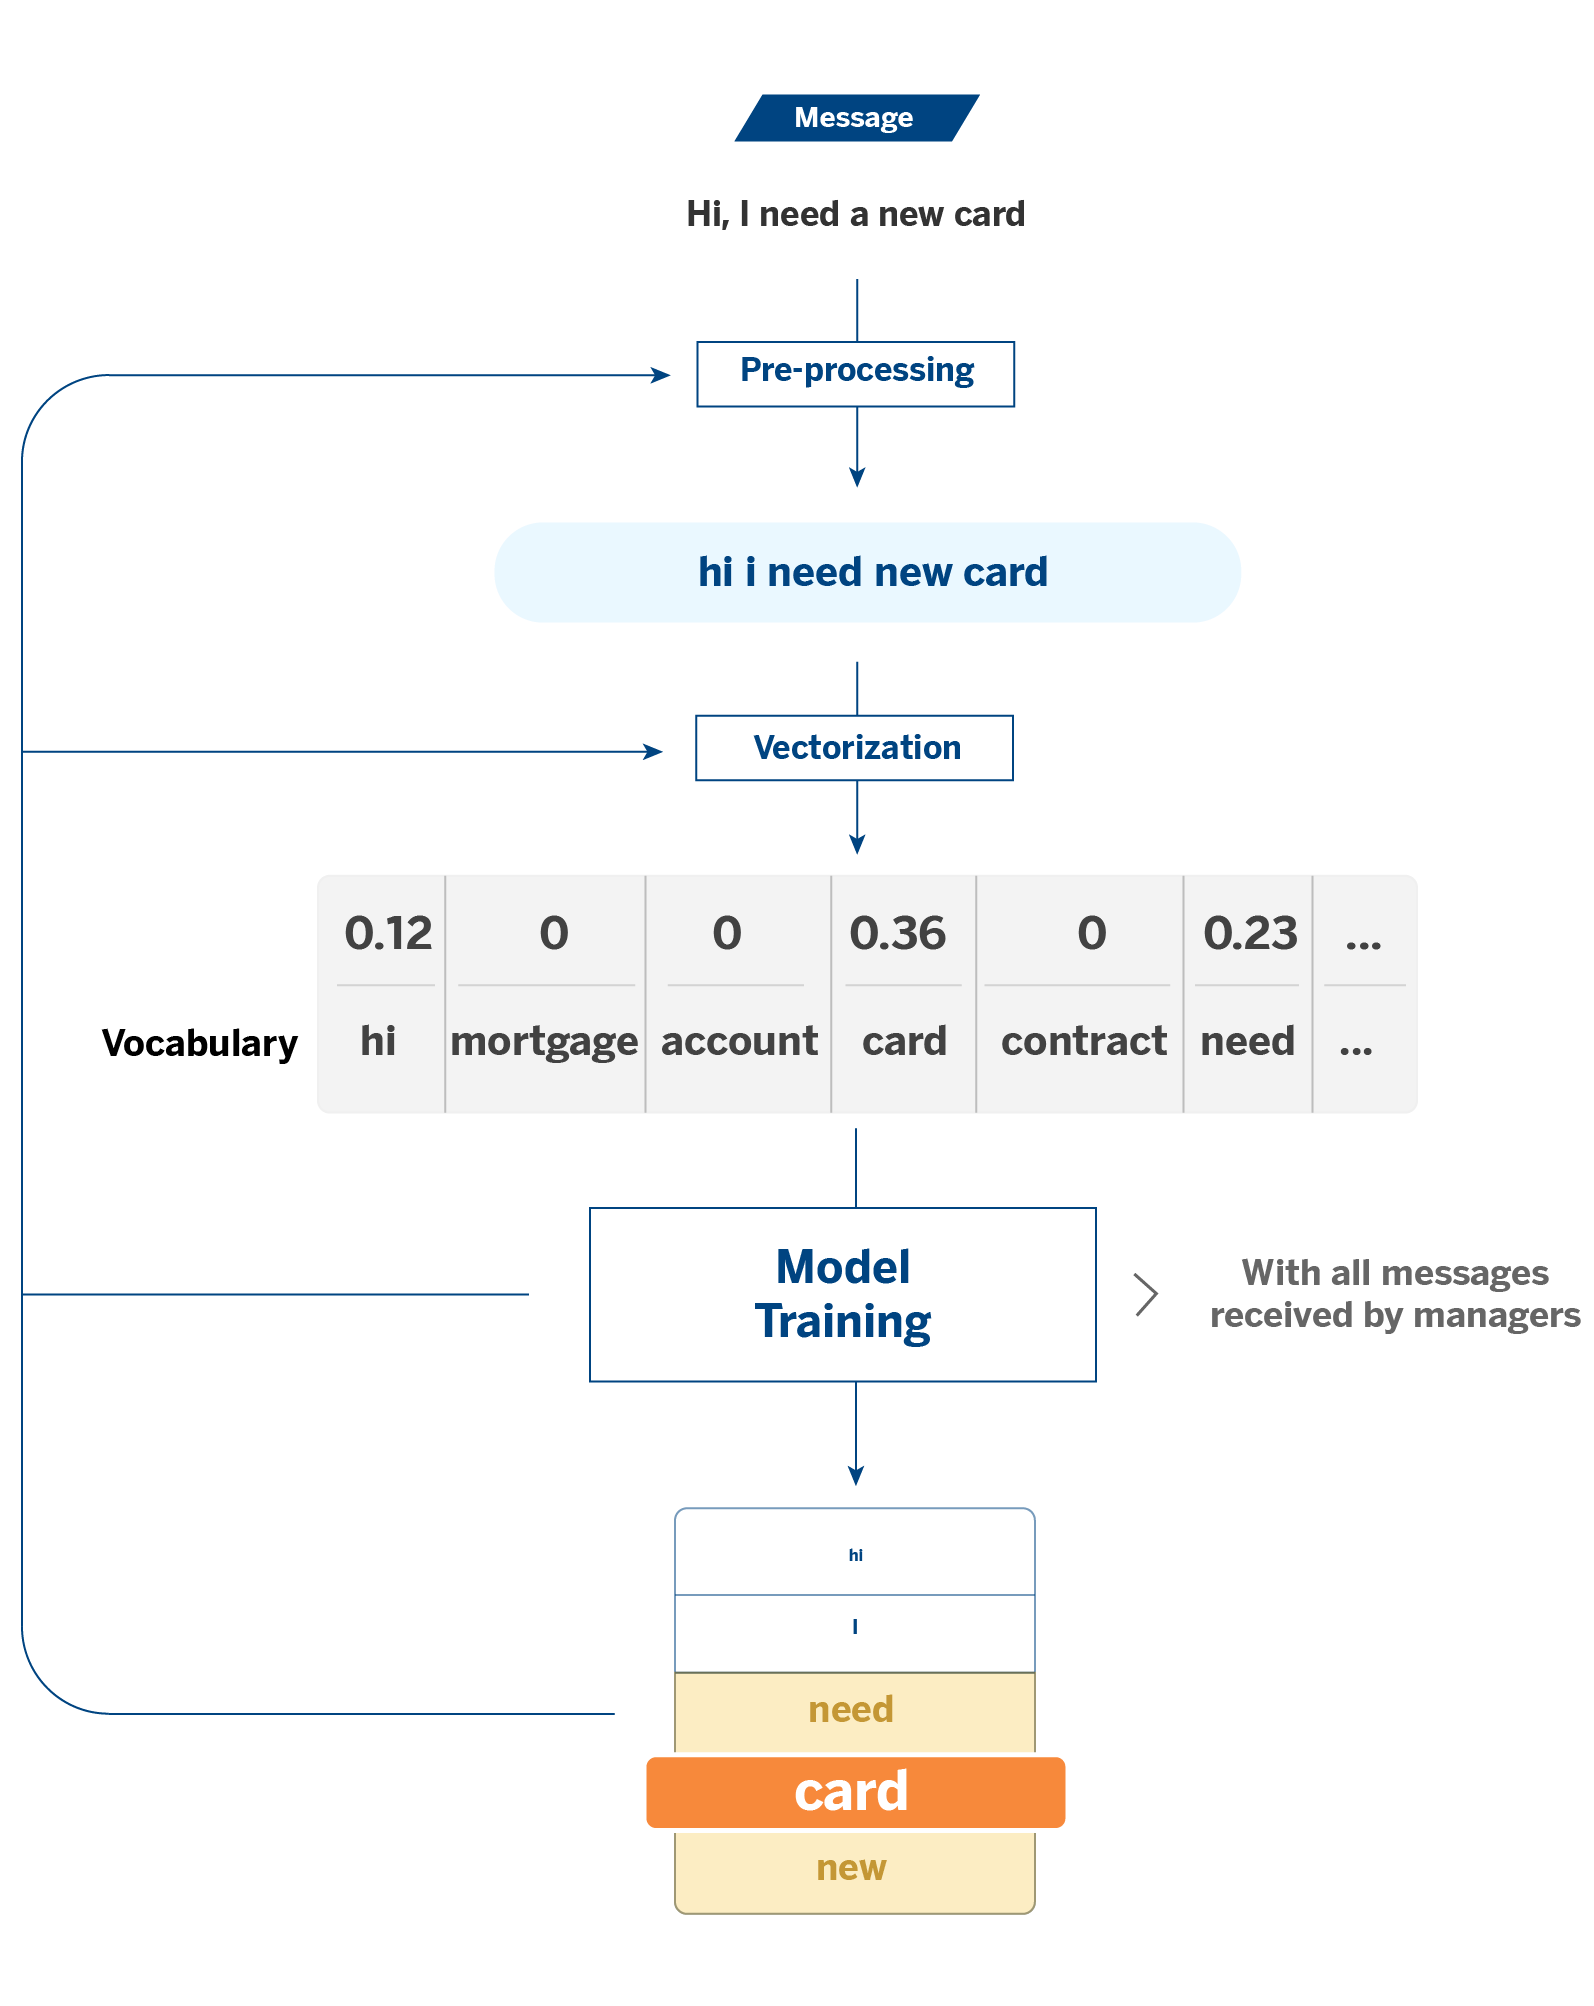
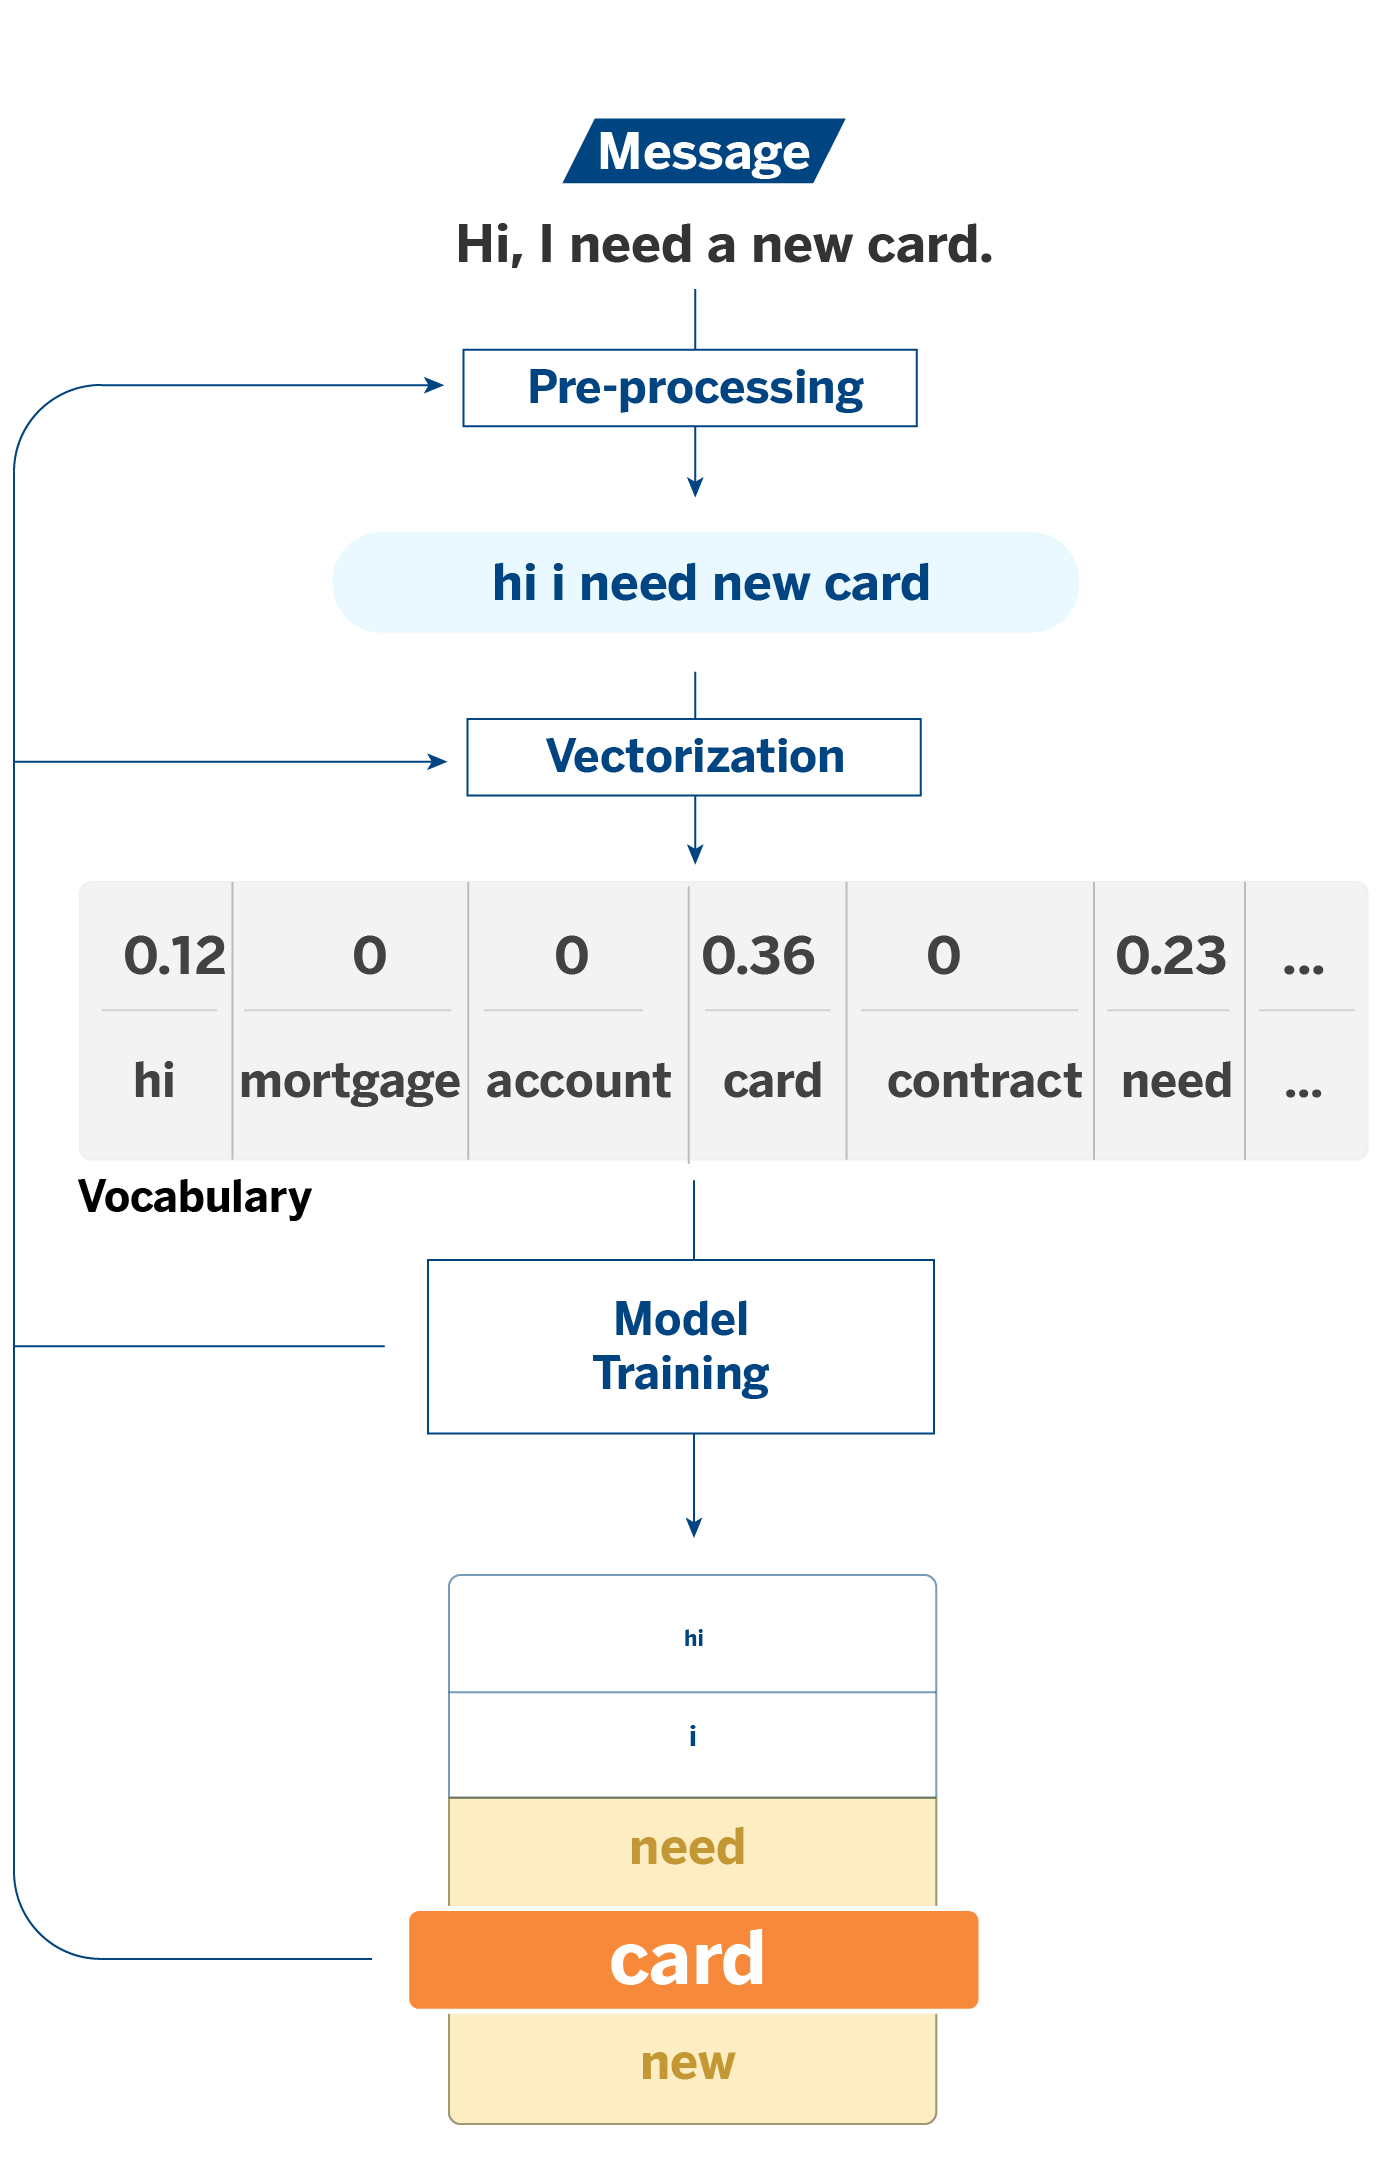
To explain this, we will start with a use case with PLN (natural language processing) models. When a bank manager has a conversation with a customer, a system labels the subject of the query. This way, we can quantify specific topics’ recurrence over others, giving us a broader view of customer needs.
In this case, the features of the models will be the words or tokens that constitute the texts. The tokens result from a vectorization process: in classical NLP algorithms, it is necessary to transform the texts into numerical variables so that the models can process them. It is on these tokens that explainability comes into play.
Based on the analysis of the feature importance and the coefficients of the models, explainability is used to measure the significance of the tokens in the assignment of the different labels. This process allows us, among other things, to compare what the initial data says with the result provided by the model; that is, to verify that there is consistency between the coefficients supplied by the model and the data with which it has been trained.
For example, if you receive a message from a customer containing the word “card,” there is a high probability that it is a message about cards. This case would be the most intuitive. However, we may encounter unexpected events, and here is where a more exhaustive analysis can help us understand what is going on: Why do unexpected tokens appear with weight in the assignment of certain labels? Do they make sense, or is noise confusing the model?
One of the models we use to classify conversations is logistic regression. In this case, to measure the importance of the tokens, we look at the value of their coefficients in the model. The coefficients take values from -∞ to +∞. The higher the absolute coefficient value, the more weight this token will have in the model when classifying it or not in a particular category.
In addition to understanding which tokens contribute the most in each category, analyzing the coefficients allows us to identify noise sources in the vocabulary with which the model is trained. For example, the model may need clarification if several words always appear together in conversations in a given category and some contribute positively and others negatively. Different solutions could be considered: valuing these words as a single token or directly eliminating them to avoid this confusion, among other alternatives.
Another way we study explainability in logistic regression is the analysis of the log of odds versus the sign of the coefficients. The log of odds is a metric that compares the probability of a token appearing in a conversation in a given category to other categories. The log of odds should be consistent and aligned with the regression coefficients. In this case, discrepancy analysis allows us to identify points like the one above, even without knowing what the conversations in a given category look like.
This process and other types of actions, like lemmatization, stemming, or filtering tokens with too much or too little frequency, among other techniques, help us to optimize the vocabulary we use to train the model. Our ultimate goal is to have a battery of words that allows us to refine the conversation classifier and understand on what basis it is making decisions. In other words, explainability, in addition to helping us understand the model, helps us improve it.

Explainability to discover patterns
So far, we have seen how explainability helps us to understand and improve our models. In addition, explainability techniques can be applied to discover patterns in data that are not obvious to the naked eye. In other words, explainability becomes a tool for conducting data experimentation exercises.
As we have seen, in BBVA AI Factory, we dedicate much of our efforts to customize our interaction with the customer to adapt to their needs. Every improvement we implement in BBVA’s mobile application is subject to A/B Testing, the technique we use to perform experiments. A/B tests help us check whether the new functionalities we include in the app are more valuable.
In analyzing an experiment, model explainability helps us discover which client characteristics most influence the use of the new functionality. As a result, we might observe that certain features are better adopted by customers with more capital in savings accounts, for example.
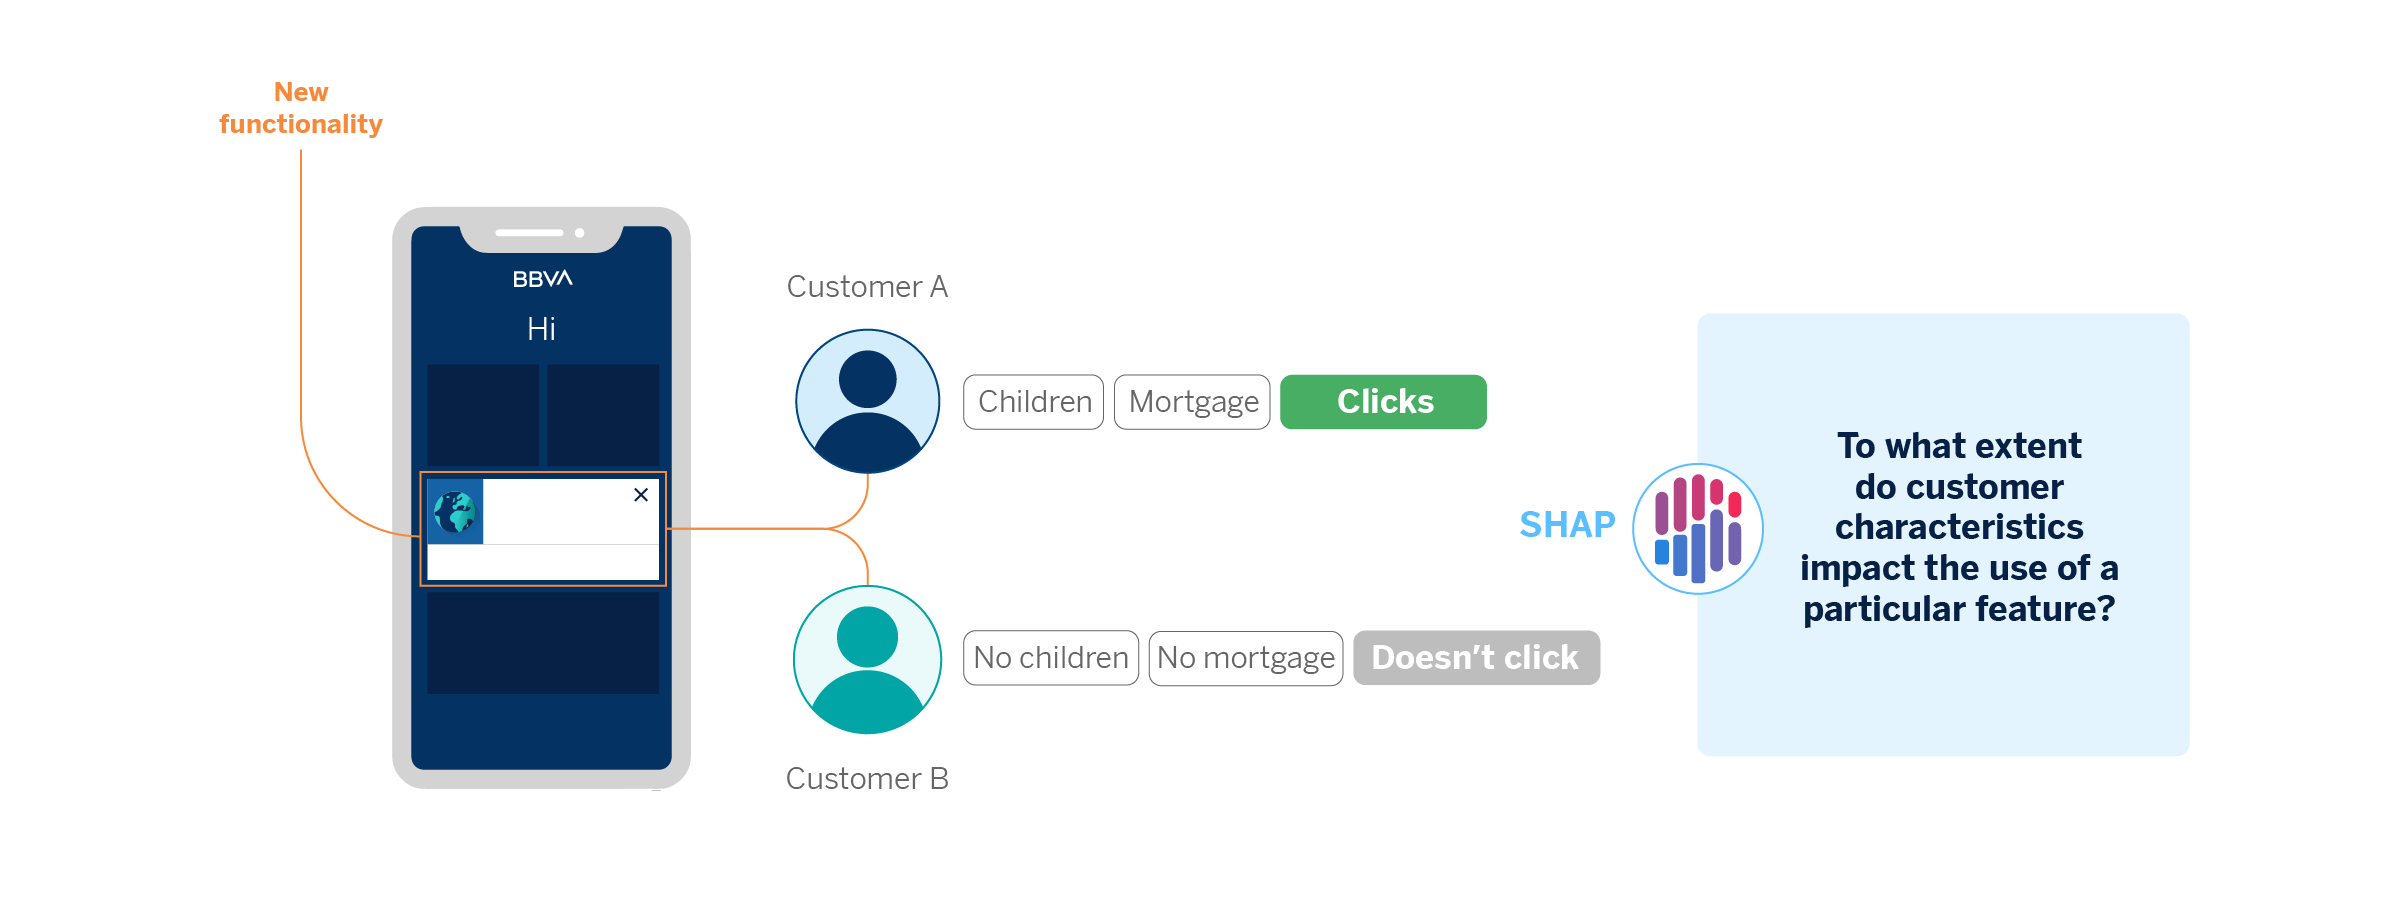
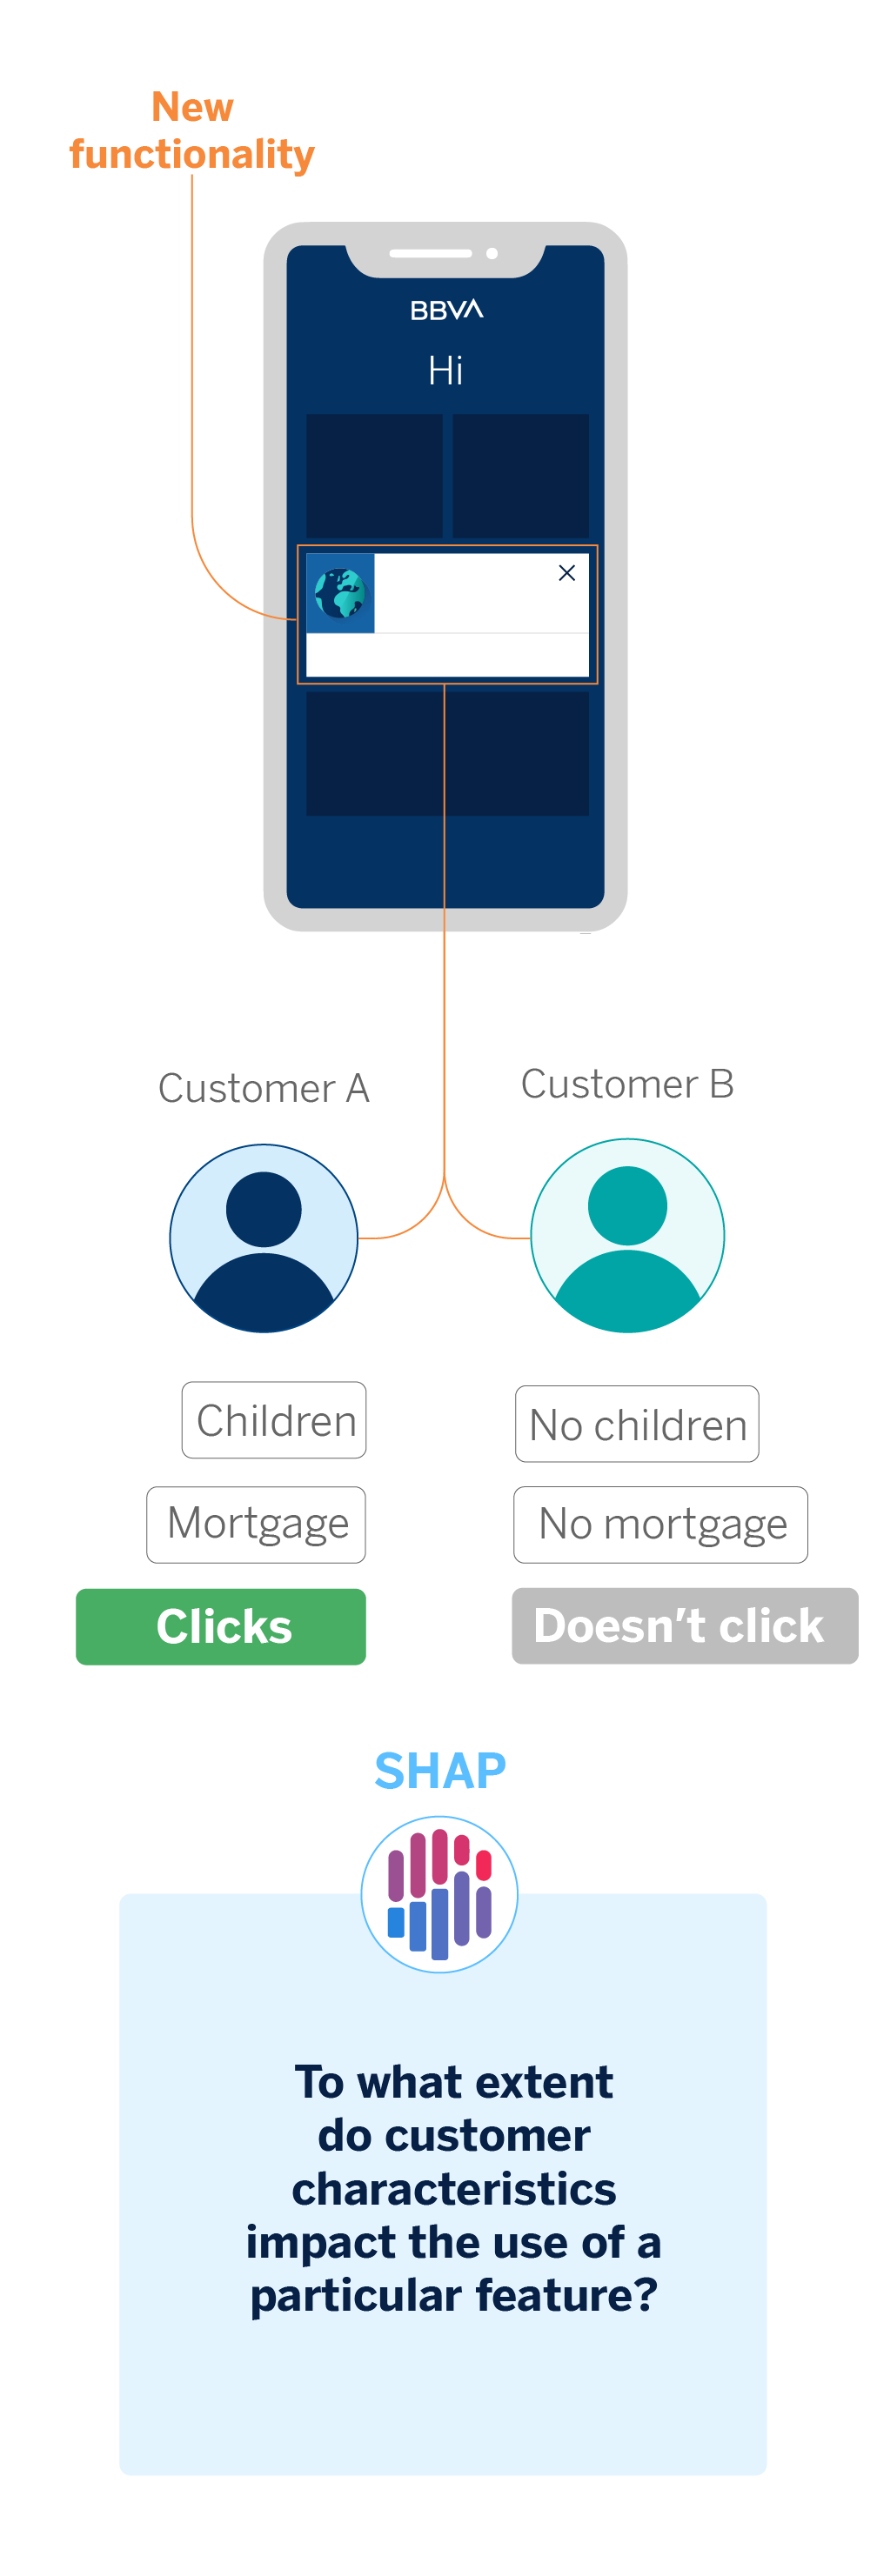
Both this use case and the case applied to messages between manager and client help us explain which client behaviors or characteristics lead our models to assign their interactions to one category or another. Regarding manager messages, we look at which words cause a message to be categorized into a particular topic. In the case of experimentation, we look at what customer attributes might explain whether or not they use a specific functionality.
Conclusions
Asking questions is inherent to human beings and differentiates us from machines. In this era characterized by the technological revolution that Artificial Intelligence implies, it is crucial to ask questions to obtain answers. Only then will we understand how these systems work for us who use them and all their consumers.
These use cases highlight some of the many questions that data scientists, users, and stakeholders ask about Artificial Intelligence models and what methods are being applied to answer them. Unraveling something folded, such as the opacity of Machine Learning systems, is crucial to understanding and improving the reliability of the models.
Notes
- To differentiate it from techniques such as Permutation Feature Importance, it is important to note that SHAP is based on the impact of the features on the predictions. The previous method is based on the worsening of the metrics of the machine learning model to obtain the importance of the variables. ↩︎