
Exploring graph analytics with mercury-graph
The solution to intricate business challenges isn’t found in standalone data points but rather in the intricate web of relationships that tie them together. Whether we’re examining social networks or investigating financial behavior, the connections between various entities often hold the most significant insights. These relationships can unveil patterns and trends that isolated data may fail to capture.
To unveil these patterns, we might think about graph analytics. Enter mercury-graph, an open-source Python library designed to simplify and accelerate graph analytics. Mercury-graph offers a technology-agnostic API that allows users to apply scalable graph algorithms without being tied to a specific framework.
Whether your data lives in Pandas, PySpark, NetworkX, or GraphFrames, mercury-graph abstracts the complexities and provides a consistent, scikit-learn-like interface for effortless analysis.
By bridging the gap between data science and graph theory, mercury-graph enables developers and analysts to focus on extracting meaningful insights rather than managing framework intricacies.
What is graph analytics?
Graph analytics is the practice of analyzing relationships between data points, represented as nodes (entities) and edges (connections). This structure allows for the exploration of patterns that traditional tabular data analysis might miss. Graphs are powerful tools because they model complex networks in a natural and intuitive way.
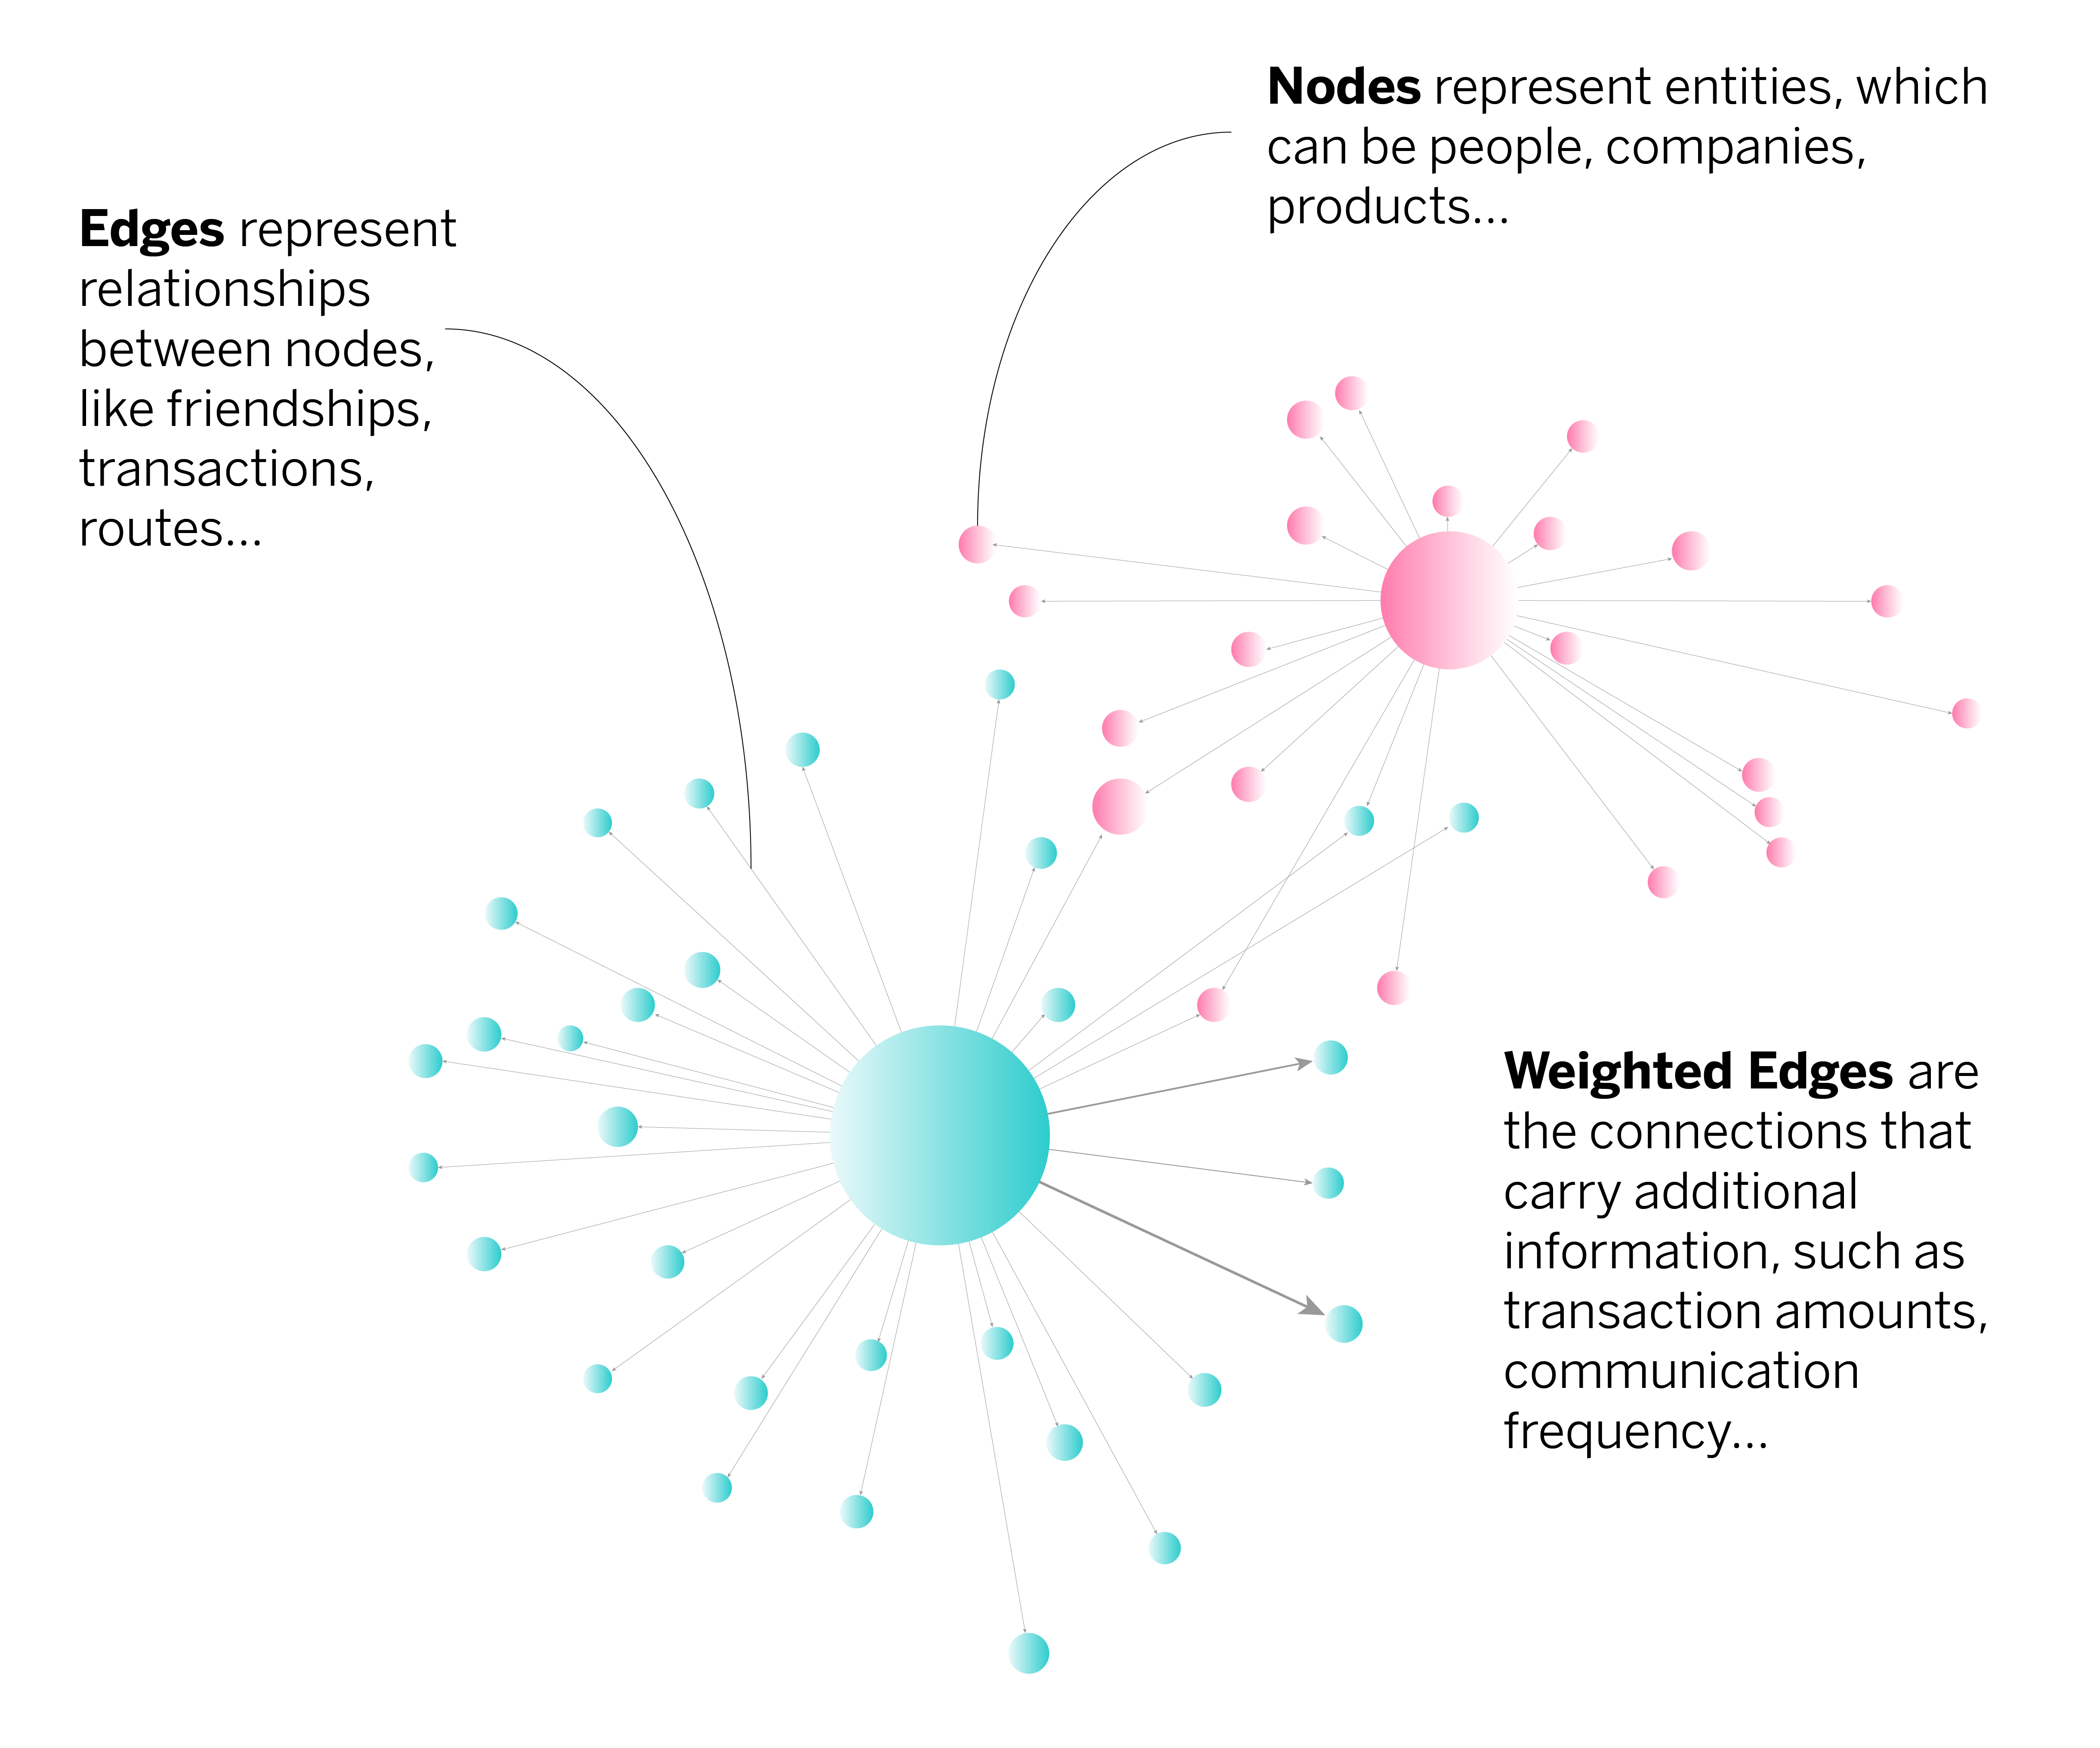
By representing data as a graph, organizations can unlock insights that would otherwise remain hidden. Graph analytics excels at answering questions like:
- Who are the key influencers in a network?
- What are the shortest paths between critical points?
- How do communities form and evolve over time?
Why mercury-graph?
While graph analytics offers immense potential, existing tools often come with limitations. Analysts must frequently switch between frameworks like Pandas, NetworkX, and PySpark, leading to inefficiencies and steep learning curves. Mercury-graph solves this by automating graph conversions between frameworks in the background. Though still required, these conversions are handled invisibly, eliminating the need for users to manage multiple versions of their data manually.
This design enables users to seamlessly apply scalable algorithms optimized for specific frameworks, regardless of the input graph’s format. For instance, if an algorithm in Mercury-graph is implemented for PySpark, but the user provides a NetworkX graph, the necessary conversion happens automatically. This feature enhances the user experience by allowing developers and analysts to focus entirely on insights, not technical overhead.
Mercury-graph stands out for its unified API, which ensures developers can switch between graph representations and algorithms without rewriting code. Its framework-agnostic nature provides unmatched flexibility, whether your data is in Pandas, PySpark, or NetworkX.
Moreover, built-in algorithms leverage technologies like Numba for accelerated computations and PySpark for distributed processing. Combined with its scikit-learn-like simplicity, mercury-graph reduces barriers to adoption and streamlines workflows for both novices and experts.
To start using mercury-graph, you just need to:
pip install mercury-graph
Mercury-graph’s submodules
Mercury-graph is organized into four main submodules, each serving a critical function in the graph analytics pipeline:
Core
This submodule forms the foundation of mercury-graph. It enables users to create, import, and manipulate graphs regardless of the data source. Graphs can be built from Pandas or PySpark DataFrames, or directly from NetworkX or GraphFrames objects. This flexibility ensures that users can transition seamlessly between frameworks without refactoring their code.
from mercury.graph.core import Graph
g = Graph(data=df_edges, nodes=df_nodes)
Embeddings
The embeddings submodule focuses on generating vector representations of nodes in a graph. Techniques like Node2Vec allow users to capture the relational structure of graphs, translating them into lower-dimensional spaces suitable for machine learning tasks. These embeddings can then be used for clustering, classification, or similarity detection.
from mercury.graph.embeddings import SparkNode2Vec
n2v = SparkNode2Vec(
dimension=100,
num_paths_per_node=4,
num_epochs=10,
w2v_max_iter=10,
w2v_min_count=1
)
n2v.fit(g)
# Show embeddings
n2v.embedding().show(5, truncate=False)
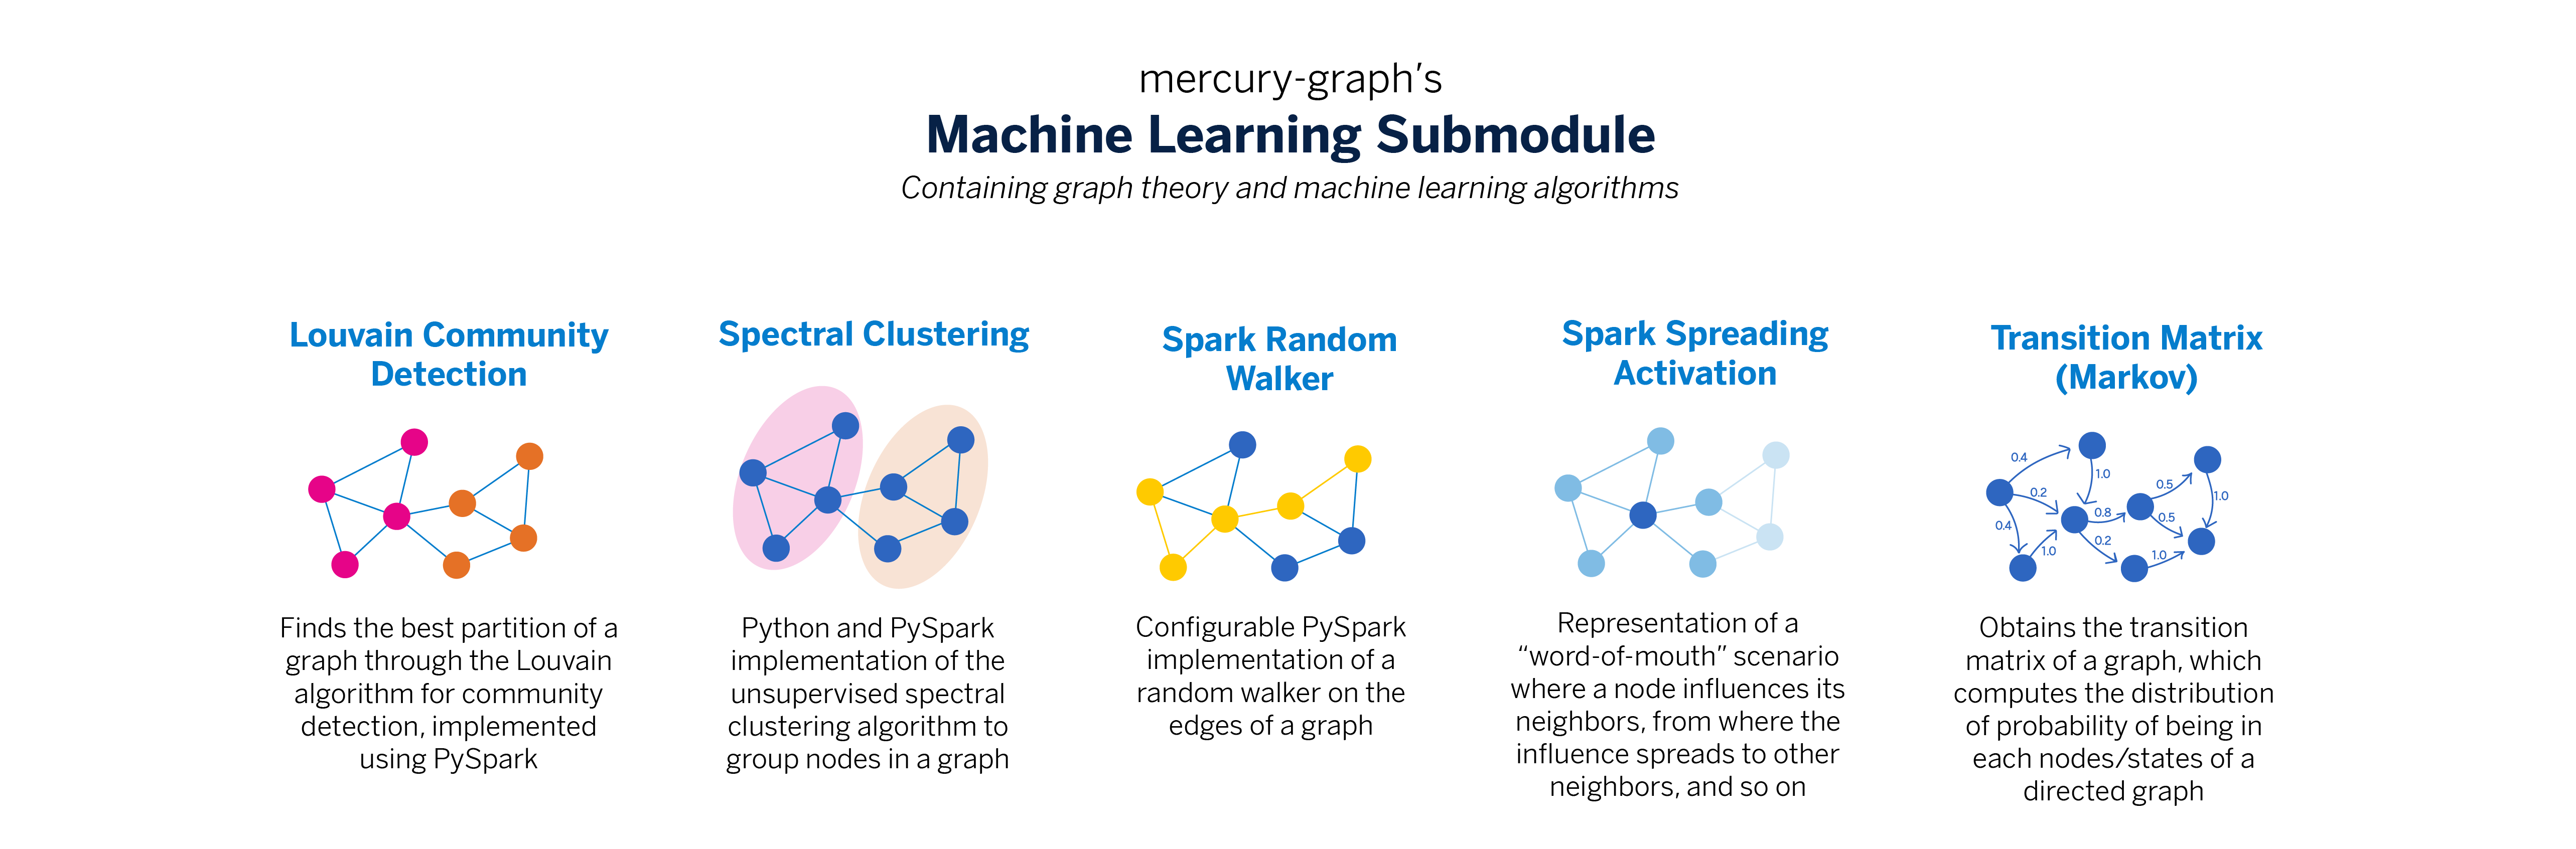
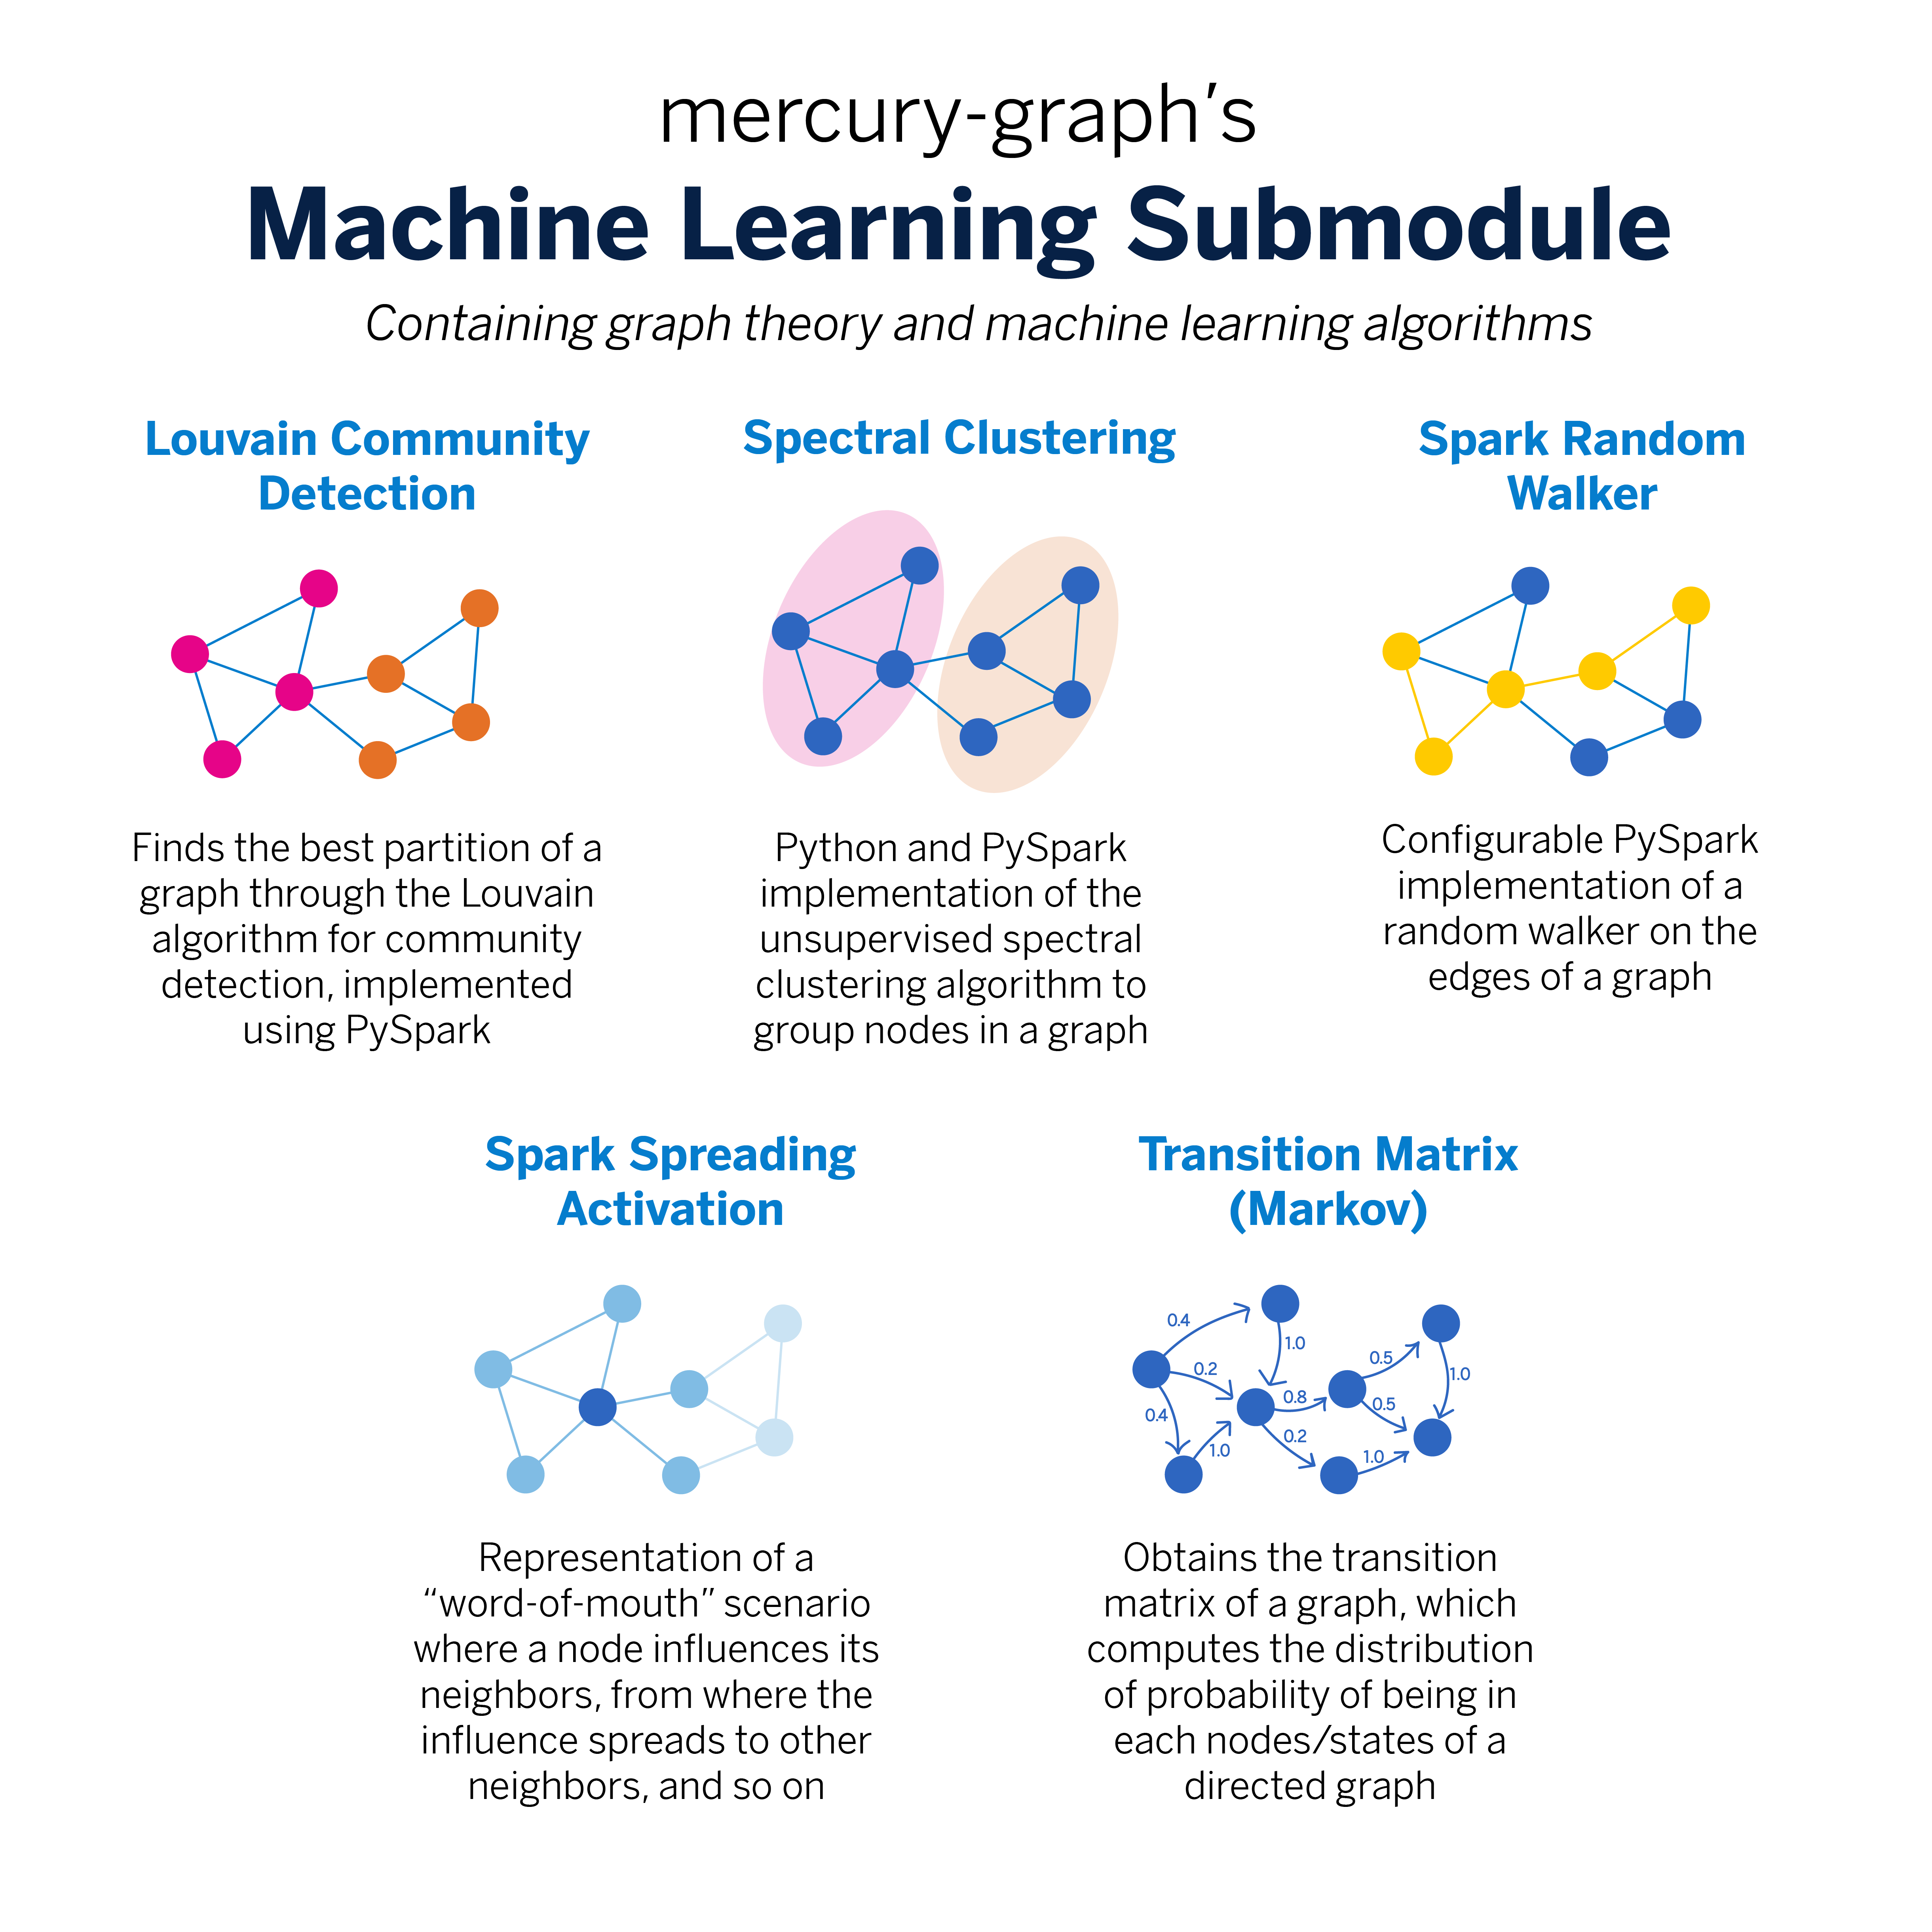
Machine Learning (ML)
This submodule provides a suite of machine learning algorithms tailored for graph analytics. Key implementations include Louvain Community Detection for partitioning graphs into communities, Spectral Clustering for grouping nodes, and Random Walks for analyzing how information spreads through a network, among others.
from mercury.graph.ml import LouvainCommunities
lc = LouvainCommunities()
lc.fit(g)
# Get communities
lc_df = lc.labels_.toPandas()
lc_df
Visualization (Viz)
The visualization submodule, highlighted by tools like Moebius, allows for interactive graph exploration. Large graphs can be visualized and manipulated dynamically, making it easier to identify key nodes, edges, and patterns within complex networks.
M = Moebius(g)
M.show('node_id')
The Mercury Project at BBVA
Mercury-graph is part of a broader initiative known as Mercury, developed by BBVA AI Factory. Mercury is a collaborative library aimed at simplifying and accelerating data science workflows across the organization. Initially conceived as an inner source project, Mercury evolved into an open-source solution that democratizes access to advanced analytics tools.
The Mercury ecosystem provides a range of data processing, machine learning, and visualization modules, with mercury-graph serving as its graph analytics component. BBVA empowers data scientists and developers globally by contributing to the open-source community, fostering innovation and collaboration.
For more information about the Mercury project, visit BBVA AI Factory’s Mercury page and BBVA’s GitHub.