Rediscovering Cities through Credit Card Data (Part 1)
Administrative municipal boundaries, such as districts and neighbourhoods, are currently used not only to rule cities but also to describe the behaviour of their citizens. In fact, official statistics and open data are published using these divisions. However they may not be the best option for none of these purposes; nowadays, people and businesses expand their activity throughout the city without boundary constraints. Thus, we believe in new means to describe the behaviour of the residents and visitors.
The Urban Analytics initiative at BBVA Data & Analytics, in partnership with CARTO, shows how the analytics of anonymized credit card data can serve to identify functional areas in Madrid, Barcelona and Mexico City, describe city dynamics and be used to compare areas from different cities.
Background
Governments organize cities by municipal districts and neighborhoods. Similarly, postal services have postcodes. But, are these divisions useful to understand what really happens in a city? These static divisions were created for different purposes and are rarely modified, even if the population changes completely. In this context, we imagined what would happen if we organized a city according to credit card payments to understand how citizens move, live and shop in a city.
Data Sources and Analytical Framework
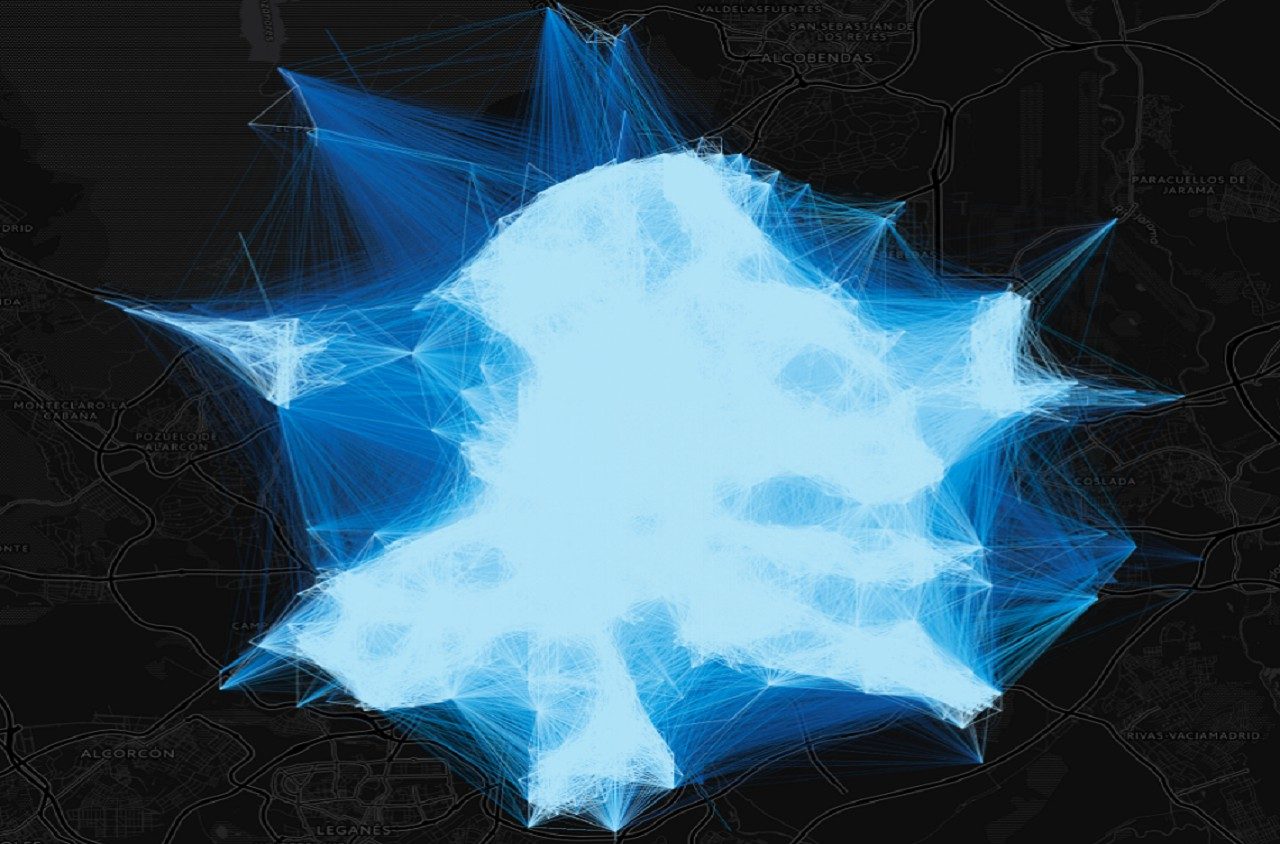
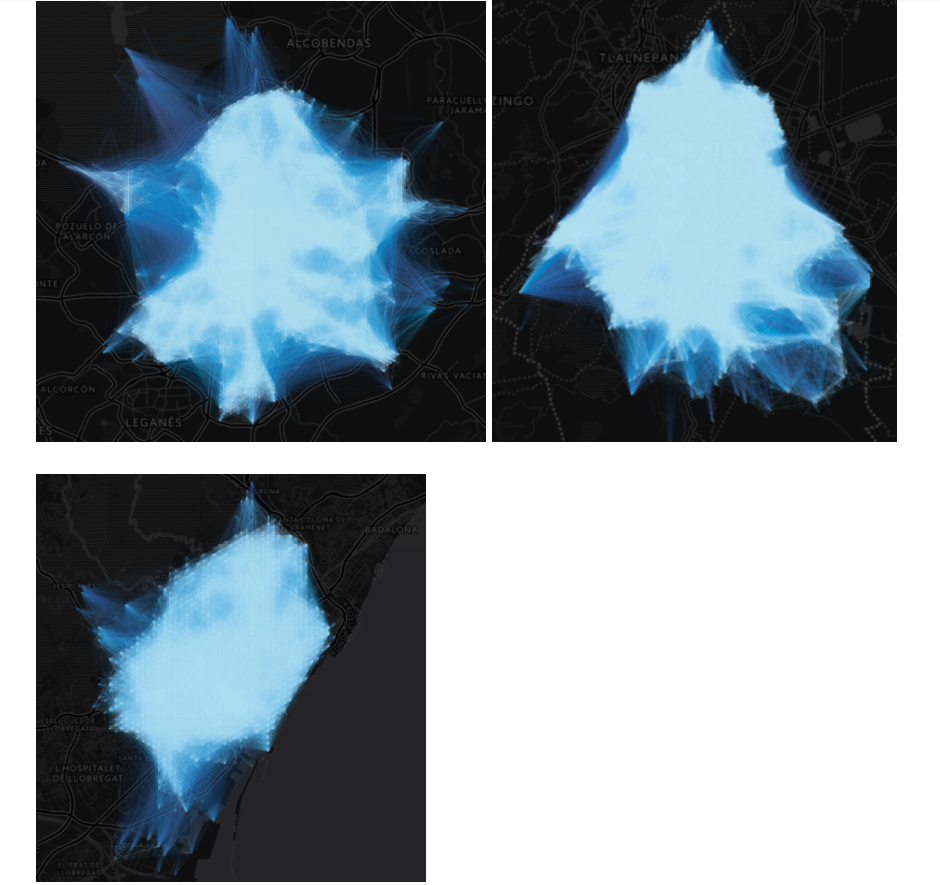
Network of connections: The first step of this project was to establish relationships between different geographical areas of a city using card transactions. In this case, we chose to describe economic mobility patterns through businesses shared customers. Firstly, every city of our case study was divided in 200-metres-side hexagonal cells. We established a maximum time interval of 3 hours to detect if the same card had been used in different cells and, every time this happened, we created a link between those cells. The application of this method during a 12 month period ensured the capture of all seasonal trends. We call these links payment duos, and this gives rise to the very dense payment duos networks obtained for the cities of Madrid, Barcelona and Mexico City.
Functional Areas Identification: These weighted undirected networks contain a lot of information about the people’s mobility Thus, analysing their structure allowed us to explore new ways of dividing the three cities. We applied several community detection algorithms based on different approaches such as greedy optimization of modularity, short random walks, leading eigenvectors, or propagating labels to each network in order to obtain clusters of strongly connected hexagons. All of them have in common that they do not require the number of communities as a parameter but they compute the optimal value internally. For that reason, obtaining similar communities using some of these algorithms was a good sign of consistency. Finally, the tests led to the selection of a greedy algorithm. Its results were similar to other algorithms’, however its computational cost was proved more optimal. We applied that same greedy algorithm to the three networks in order to make comparisons between cities possible. Finding twin zones is also possible thanks to the use of a common methodology.
These clusters, that we called macro-communities, had a similar size as administrative districts, but not surprisingly did not cover the same territory. Some interesting similarities and differences emerge at this point. However, these ‘macro-communities’ seemed to be too heterogeneous to be associated to common patterns of consumption. Thus, we applied again the greedy algorithm on each macro-community (using only the corresponding part of the payment duos network) to obtain a more detailed division that we called ‘communities’. Their smaller size made possible to extract visible and reliable attributes. It is worth noting that the shapefiles containing the macro-communities and communities for each city are available to download.
Description of communities through attributes of consumption: In order to build the attributes of consumption that would describe each community we used the whole dataset of transactions carried out in the cities during a year. We extracted more than 25 variables describing properties of three agents: merchants, cardholders and the timestamp of the transactions. Every hexagon was assigned a discrete value (low, medium or high level) for each variable representing how it was compared to the rest of hexagons in the city. For example, the variable ‘Domestic tourism’ measured the amount of money spent by domestic tourists in the merchants placed in each hexagon. Once this value was calculated for each hexagon, a ranking was created and the discrete values assigned: ‘High’ to the hexagons in the upper quartile, ‘Low’ to those in lower quartile and ‘Medium’ to the rest.
Instead of just showing the value of each variable, our aim was to compare each community with the rest of the city and find the variables that make each different. For this purpose, we generated a classification model for each community. Let’s suppose that we wanted to know which variables distinguish the community C from the rest of the city. Then, the response variable y of the model is whether a hexagon belongs to C or not. The training dataset is composed of the whole bunch of hexagons of the city with all the discrete variables assigned before. As we were only interested in finding which variables were significant for the model, not only we didn’t avoid the overfitting but we even looked for it. Thus, as the dataset was unbalanced (the number of hexagons belonging to C was much smaller than the number of hexagons that didn’t) we chose to use a simple random over-sampling technique to make it balanced. Once the datasets were prepared we trained a logistic regression and a decision tree for each community. We found the variables that would describe each community by looking at the significance values returned by the models.
The last step of the characterization process was to combine variables to create the 17 meaningful attributes of consumption used in the tool. For instance, the attribute ‘Culture’ doesn’t only refer to communities where there are museums and art galleries but it also to a community that attracts cardholders that spent more than the average in that kind of places. Another good example of attribute is ‘Residential Area’. No external sources were used, but using the timestamp of the transactions we could find areas that don’t have activity during the working hours, that the number of merchants is low and the activity of tourists is almost nonexistent. The combination of these three variables (activity during working hours, number of merchants and touristic activity) results in the attribute.
Tool
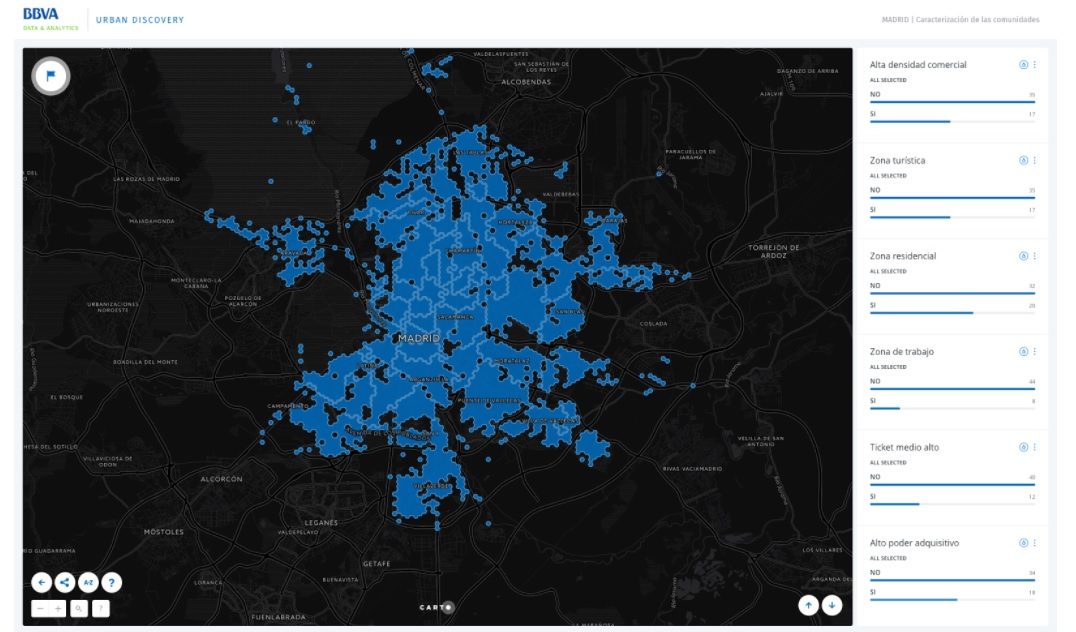
Apart from the results of the community detection step, the data story contains an interactive map that allows users to select which attributes they are interested in and see which communities have them. For example, anyone interested in buying a house could use the filters to find areas where there are people of a specific range of age, or specific type of shops.
Each attribute has its own widget with two values: YES and NO. Users can select one of the values to filter the map and maintain lighted only those communities that have the value selected. Furthermore, more than one widget can be used at the same time to look for communities that have all the selected values. CARTO’s autostyle button (the water drop icon) allows the users to preview how the values of an attribute are distributed among the remaining communities.
Users can create their own tags for the cities. After filtering the map, they can assign a name to the lighted area using the flag button placed on the top left corner. These feedback will be useful to see how these cities are seen by their inhabitants. In addition, those users that use the tagging tool will be offered to see which areas will remain lighted with their filters in the other cities. Thus, users can establish comparisons and find twin zones between cities.
In conclusion, this project shows a way of applying data science methods (network analysis and classification algorithms) to georeferenced financial data in order to describe big cities from an economical perspective. In this case, the aim of the project was to generate an open website to allow everybody (individuals, companies, administration…) not only to navigate through the results but to download and use the resulting divisions and attributes. We hope they will be useful for many applications.