
Detecting balance anomalies with uncertainty models
The development of Artificial Intelligence in the financial sector drives the creation of new data-based products, which are often linked to a new form of relationship between customers and financial institutions. In this sense, one of the main trends is related to the generation of personalized services and products that allow us to better manage our finances. The BBVA app incorporates a feature that shows the user their estimated balance at the end of the month. This prediction can be of great interest to our customers because it lets them know their current financial status so that they can make more informed decisions.
Nevertheless, as with any prediction, the value offered is never totally certain; the uncertainty involved in any estimate must be taken into account. Machine learning systems cope with several uncertainty sources when they produce predictions. Hence, we are actively introducing models for this kind of uncertainty during the development stage of our data-based products. This aims to improve the interpretation of the results and offer the customer more reliable information.
A forecasting model without an uncertainty estimation would only generate a point estimate of the balance. However, the uncertainty model allows us, on the one hand, to better understand the confidence in the balance prediction and, on the other hand, to build additional interesting applications -for instance, the early detection of high overdraft probability so as to to guide actions to prevent such events-. As a result, we are able send direct notifications to the customer in order to report relevant changes to their balance.
In the 2020 edition of the KDD Workshop on Machine Learning in Finance we have presented one of our latest solutions1 which uses our balance model with uncertainty to detect balance values far from the expected ones.
With this engine, we can detect unexpected ‘spikes’ in balance series that may point to relevant changes in the customer’s situation or events that require immediate attention. These types of events appear as disruptions in the series, and generate values outside the confidence bounds detected by our engine. Let’s see this with a real example.
At the beginning of each month, our engine offers a prediction of what our balance might be for the end of the month. In fact, the model always calculates the prediction for the forthcoming 30 days even though the customer can only see the value corresponding to the last day of the calendar month.
The model contemplates the possibility of an occurrence of different behaviors rather than the expected value offered by a specific prediction. Therefore, it also takes into account the expected distribution of the future values of the series. In the example above, we see the distribution for the following day. In short, even though a single value can be selected as a prediction of the future balance, the model considers alternative realities and provides different future values with various probabilities of occurrence. Such variations are within the norm.
The variety of ranges obtained from the distribution of values for the following day (tomorrow), can also be drawn in our time series (see below), to allow us to check the values which might be within our confidence bounds for the next day. The same exercise can be done for the next 30 days to see the confidence bounds for the entire month, and the value we offer as a prediction (median).
The prediction deviation seen above will not always be the same, but will depend on the customer’s behavior. This deviation will increase when predicting values for a more distant future. For example, the range will be narrow for a customer who has low variability in their balance. However, in all cases, this range will be greater for predictions a week later than for the following day. We can now say that, on any given day, it could be an anomaly if the real value is outside the confidence bounds that cover most of the possible scenarios. Being aware of these types of very unusual changes can be extremely useful for customers.
Up to this point we have seen a model for predicting changes in a balance at 30 days, which also includes a measure of uncertainty. On the one hand, this measure of uncertainty tells us the confidence we have in the prediction values, and, on the other hand, what deviations we might expect.
Now it is time to contrast, day by day, the model’s prediction with real behavior. This is where anomalies can be detected, and that occur when an observed transaction is outside the range set by the model. When this happens, we can activate warnings in the form of push notifications or messages within the app to inform the customer quickly and directly. In addition, by contrasting the real values with the ones expected, we can also update the prediction of the days remaining in a given month and use this data so that the model knows more and more about the behavior of the customer in the future.
But it is also possible to extract information of interest for the client before the real value is produced, that is, taking as reference the predictions and the range of possible deviations. This is what happens when we want to detect, for example, an overdraft before it occurs. We can find a situation in which, even though a punctual prediction of the value does not correspond to a negative balance, the probability of the series taking negative values is relatively high. In this case, even if the overdraft does not finally occur, it can be very useful to transfer this information to the customer so that they can take corrective measures if necessary.
We have seen a real case in order to check how our model works and how we can detect unusual movements. With the aim of making it easier for customers to analyze what has happened in each case, we select the most important financial transactions in the periods with unexpected events to facilitate the analysis of the situation. Here, the underlying technology is a deep recurrent network (as explained in the linked paper), using an uncertainty estimation method known as quantile regression. We have studied whether these movements conform clusters by applying graph analytics for the relations between transactions and their characteristics:
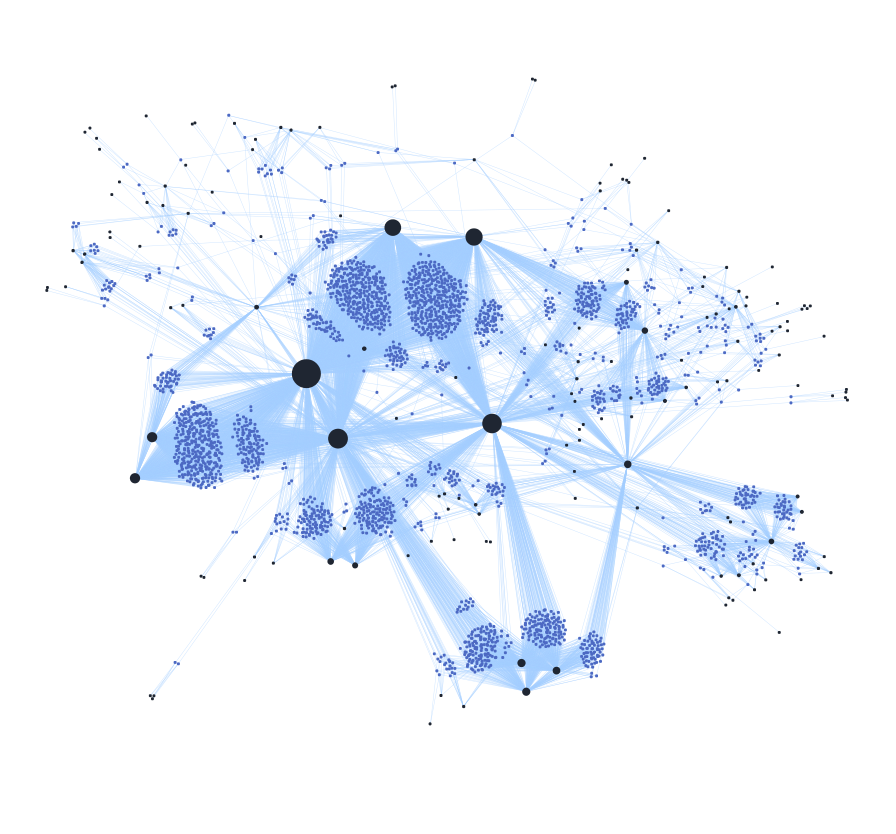
With this representation, we can obtain an embedded representation of financial transactions using methods such as node2vec, to analyze and understand the relationship between different groups of transactions. Specifically, node2vec produces a representation of the nodes in the graph as numeric vectors that can be used as input of dimensionality reduction or clustering methods. Embeddings of financial transactions have been applied in the banking industry, as we saw in the case of Capital One . We have verified that such embeddings capture semantic information about the transactions, such as information about their categories or scale.
From our standpoint, our solution illustrates the enormous potential of advanced analytics and the integration of heterogeneous analytic processes in real financial problems. We truly believe that the relevance of these results will be ever increasing in the near future, both in terms of industrial applications and of applied and academic research interest.